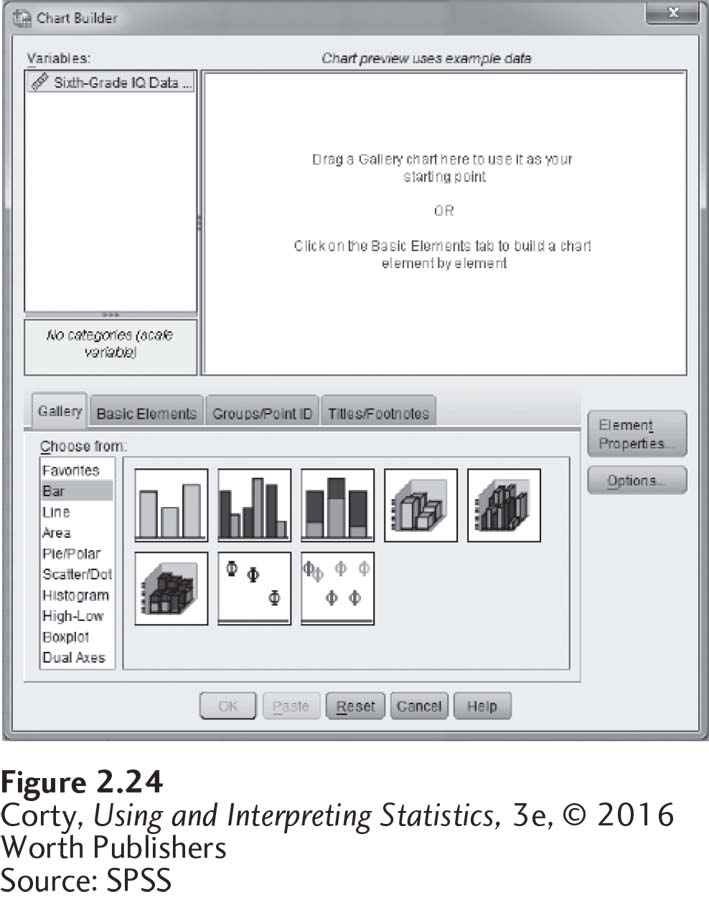
Figure 2.43: Figure 2.24 Chart Builder Screenshot The list on the bottom left shows the different categories of graphs available, while the pictures to the right show the different options within a category. In the list, there are bar graphs and histograms; look under “Line” to find frequency polygons.