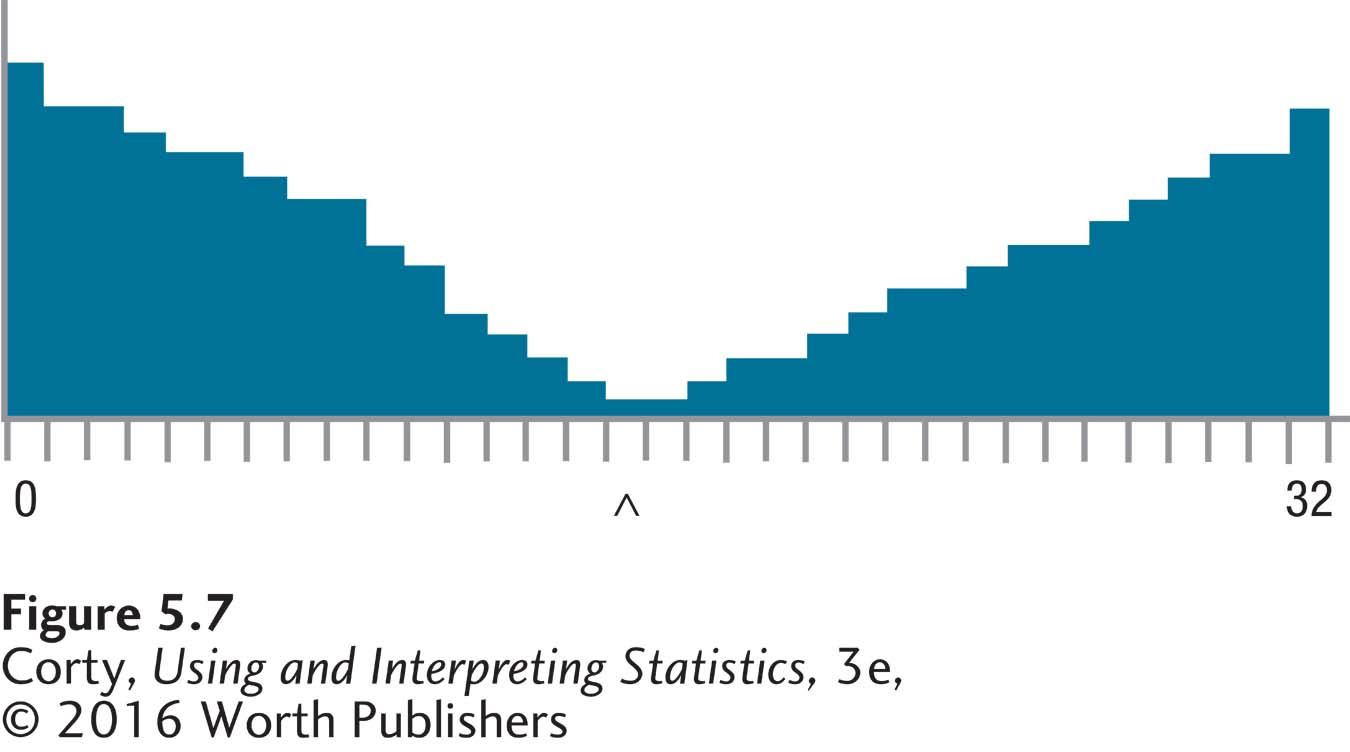
Figure 5.9 Figure 5.7 Histogram for Values in Entire Population The range of values in this population is from 0 to 32, and the shape is decidedly not normal. The caret marks the population mean, μ = 15.00. (The population is generated through Rice Virtual Lab in Statistics.)