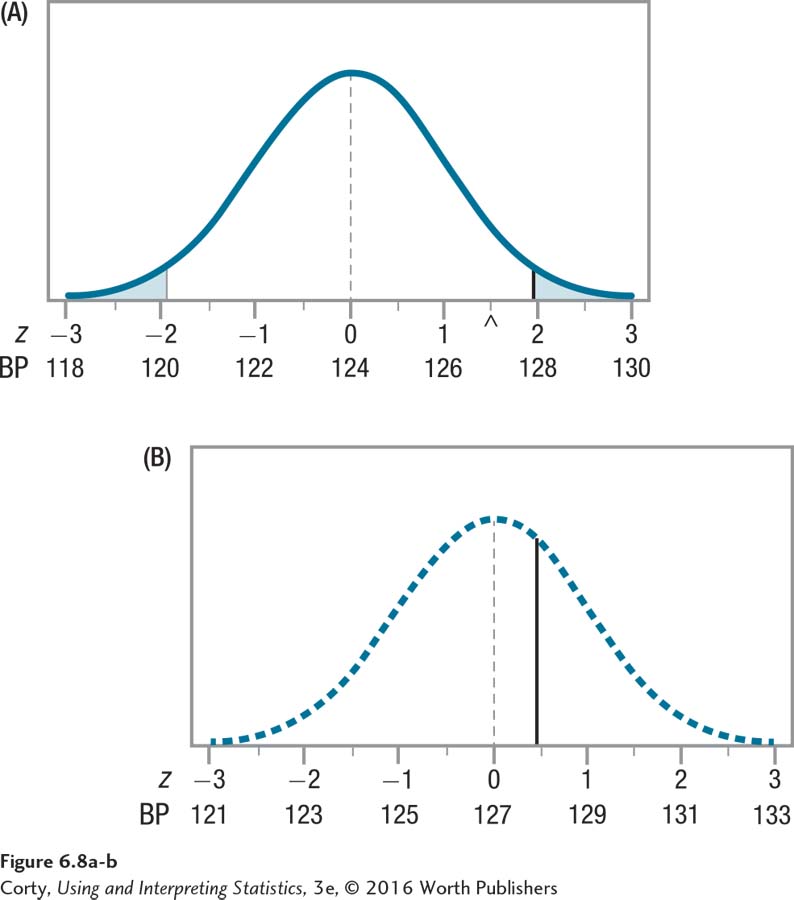
Figure 1.13 Figure 6.8 Sampling Distribution if μ = 127 The top panel (A), centered at 124, is the same as the sampling distribution in Figure 6.7. The bottom panel (B) is centered at a blood pressure of 127 and shows what the sampling distribution would look like if that were the population mean. The vertical line in the bottom panel is an extension of the critical value, z = 1.96, from the top panel.