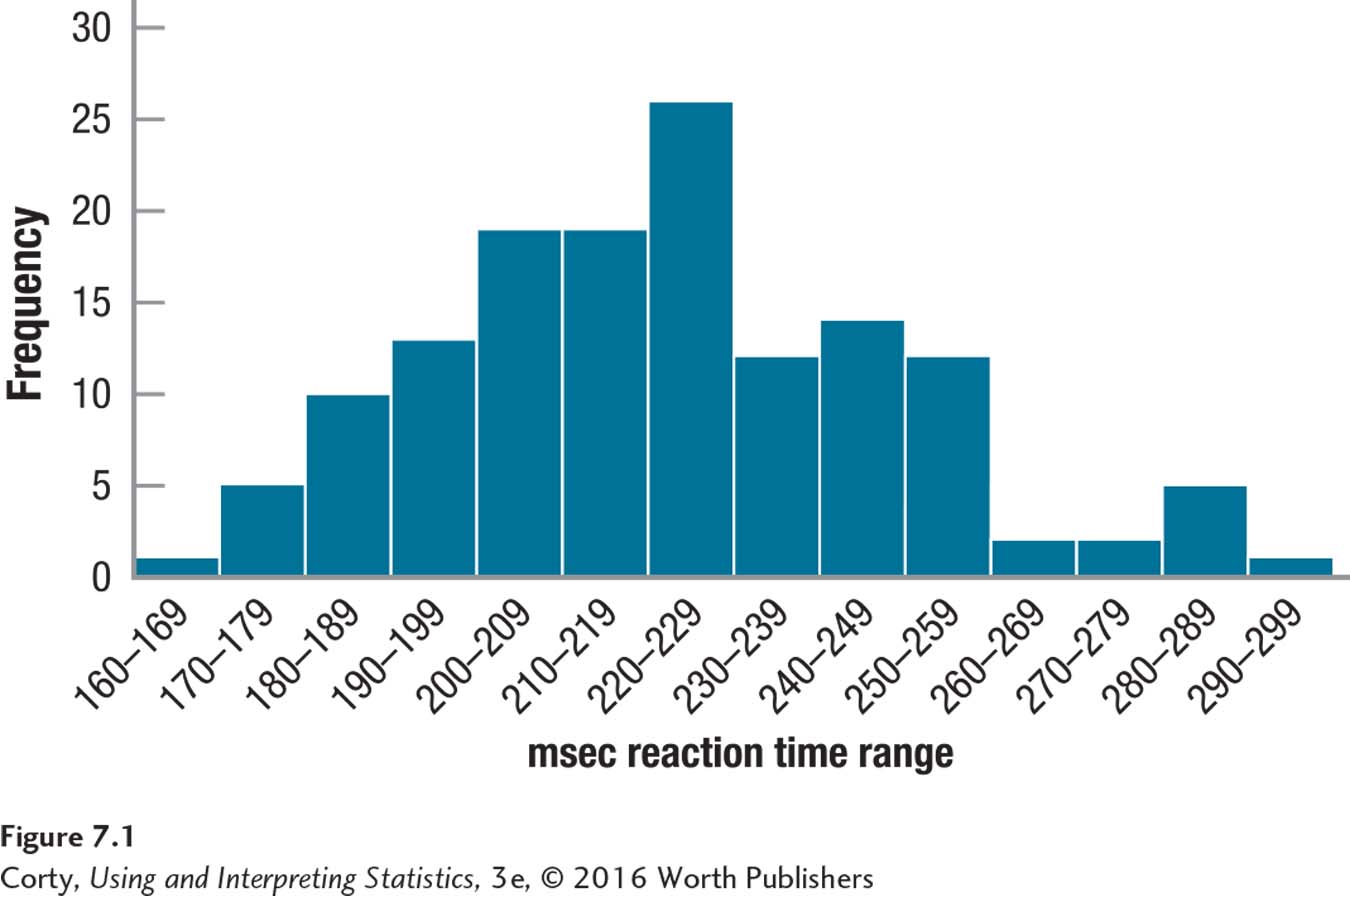
Figure 7.2 Figure 7.1 Histogram Showing Reaction Time for 141 Adults with Diagnosis of ADHD One way to check the normality assumption, if the sample size is large enough, is to make a histogram and examine it to see if it appears normally distributed. This graph of Dr. Farshad’s reaction-time data looks reasonably normal-ish.