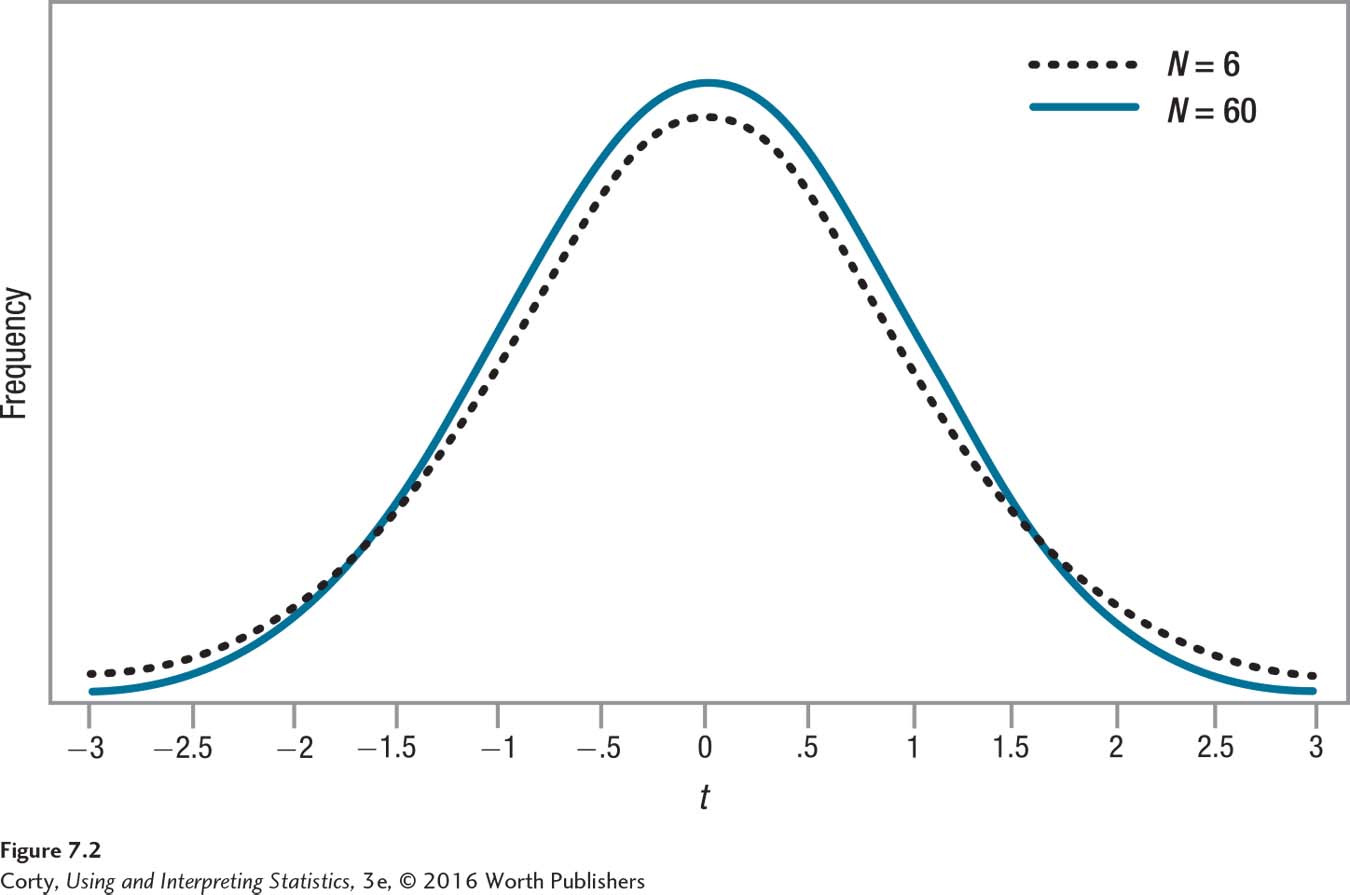
Figure 7.3 Figure 7.2 Shape of Sampling Distribution of t as a Function of Sample Size This figure shows how the shape of the sampling distribution of t changes with the sample size. When the sample size is small, there is more variability and more samples have means that fall farther out in a tail. As a result, the critical value of t falls farther away from the midpoint when the sample size is small, making it more difficult to reject the null hypothesis.