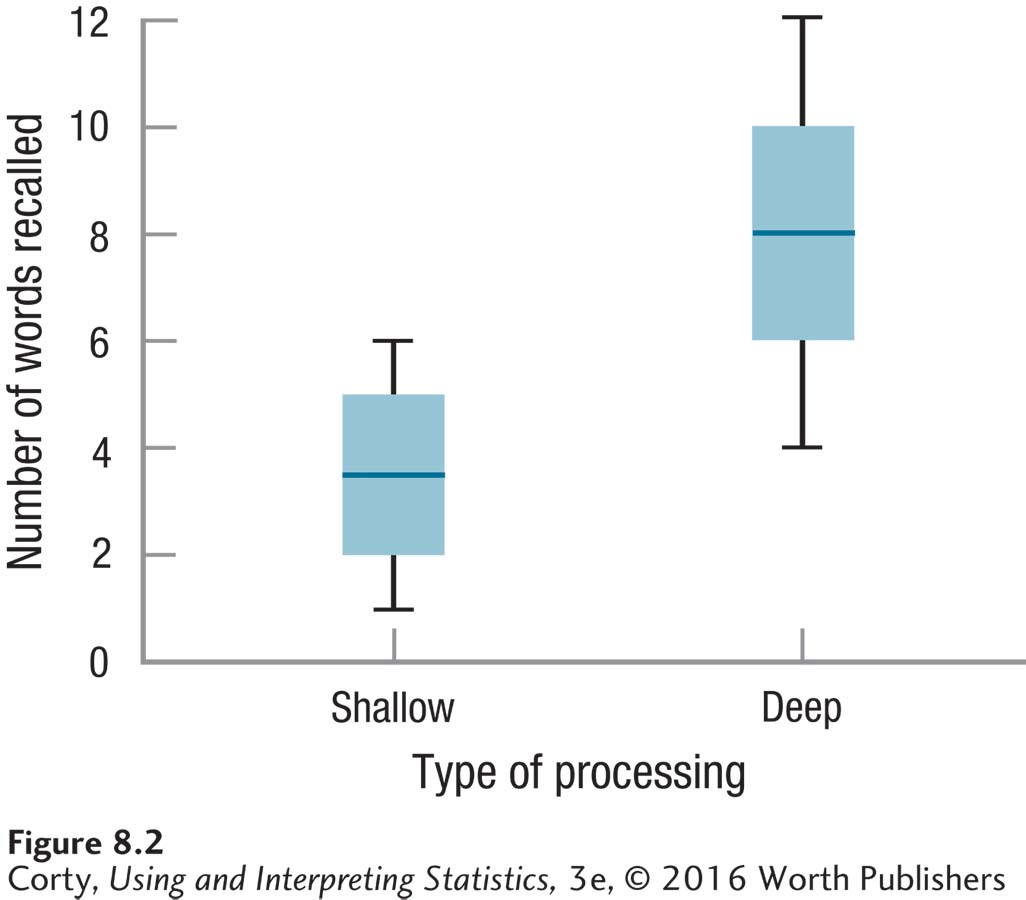
Figure 2.3 Figure 8.2 Box-and-Whisker Plots Showing the Results of the Depth of Processing Study Note that the middle 50% of cases, represented by the box for the deep processors, recalled more words than the average cases for the shallow processors. This graph appears to show that deep processing leads to better recall than shallow processing. To make sure that the result is a statistically significant one, a researcher would need to complete the appropriate hypothesis test, an independent-samples t test.