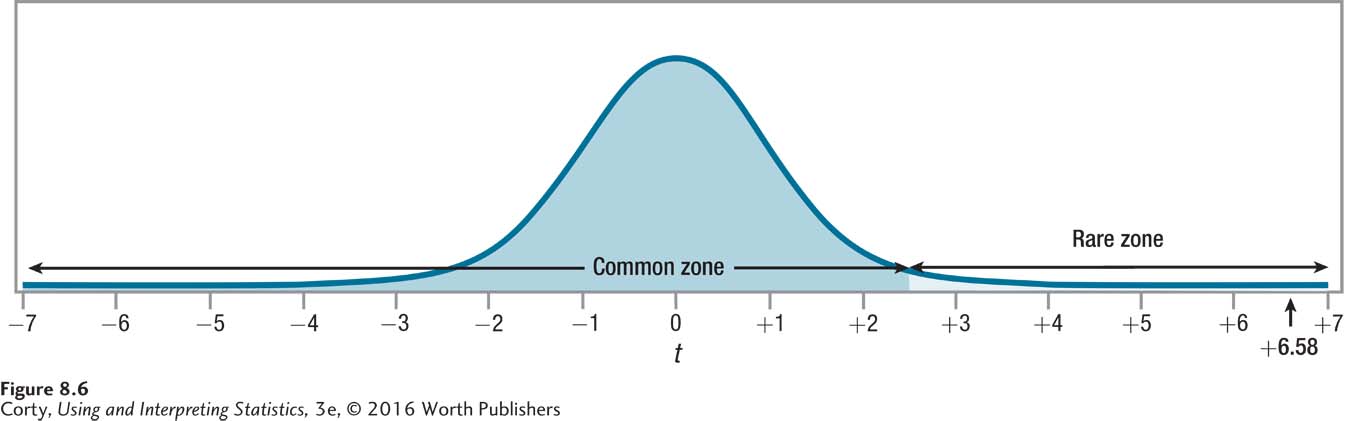
Figure 2.9 Figure 8.6 The Test Statistic for an Independent-Samples t Test for the Depth of Processing Data The test statistic t, 6.58, falls in the rare zone, so the null hypothesis is rejected. The alternative hypothesis is accepted. Because this is a one-tailed test, the alternative hypothesis states the direction of the difference.