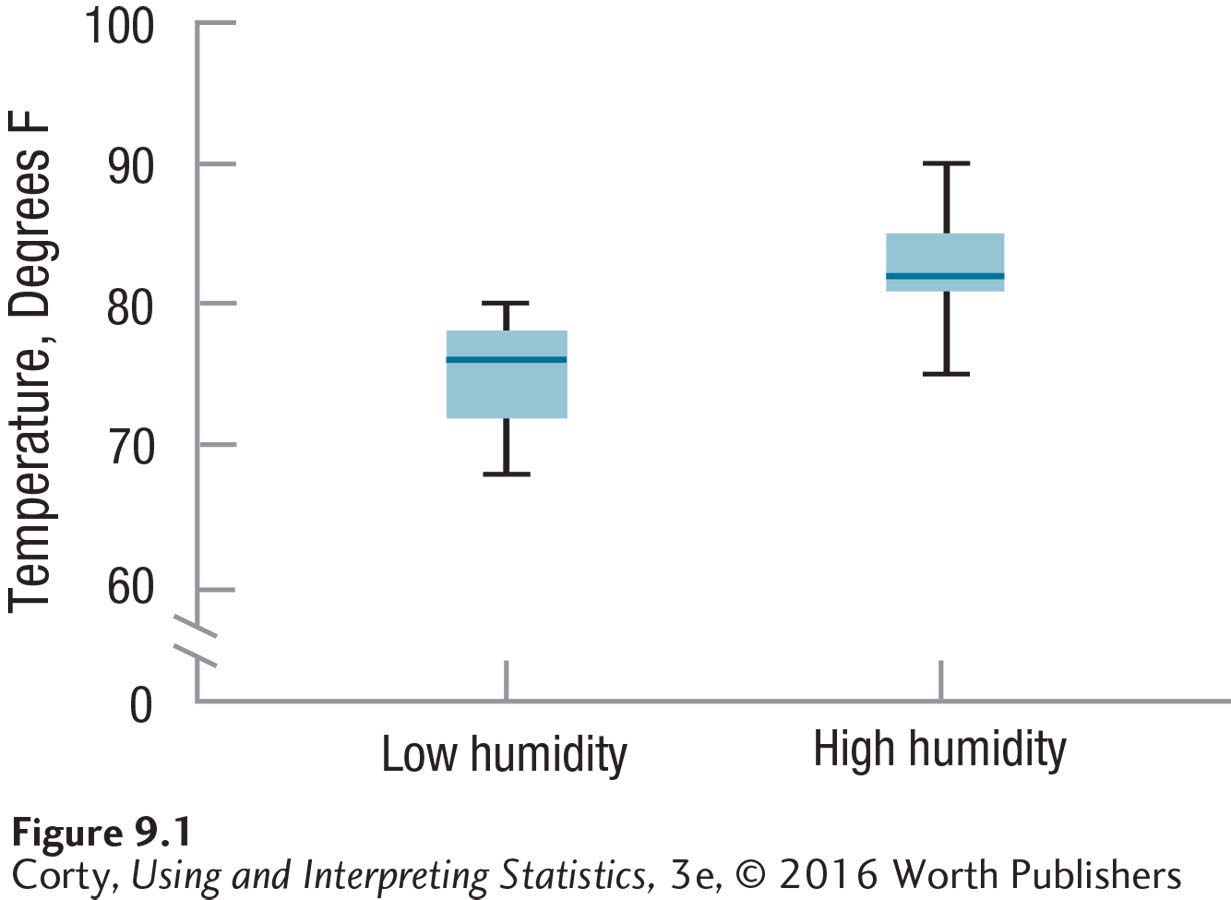
Figure 9.2 Figure 9.1 Box-and-Whisker Plots Showing Perceived Temperature in Low- and High-Humidity Conditions This graphic appears to show that temperature is perceived as hotter when the humidity is higher. To determine whether the difference between the two conditions is a statistically significant one, a paired-samples t test is needed.