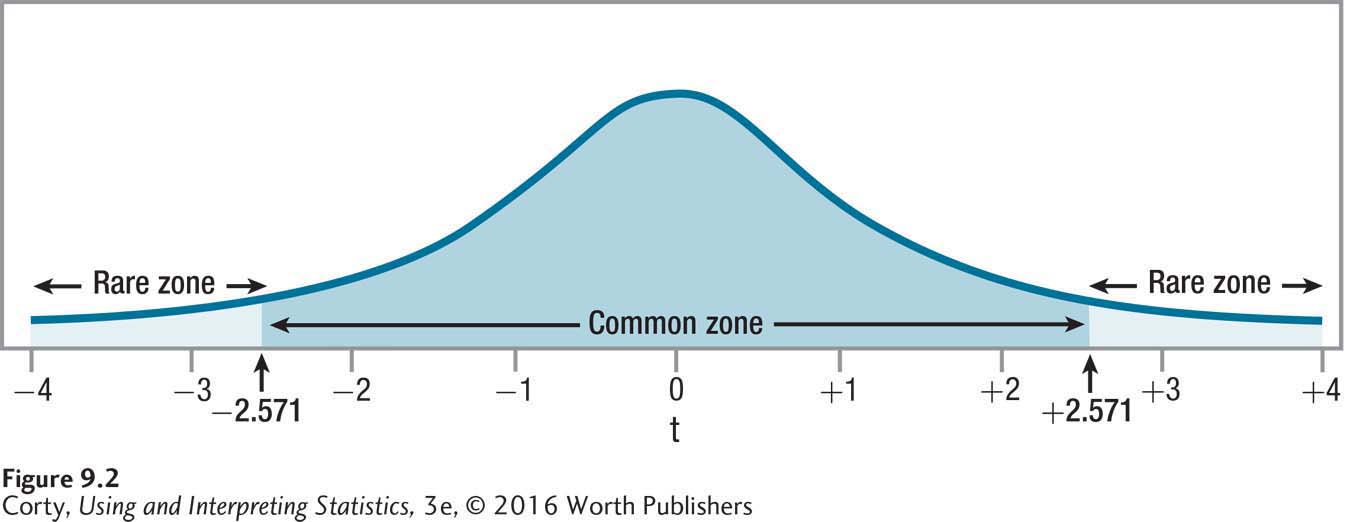
Figure 9.4 Figure 9.2 Critical Value of t, Two-Tailed, α = .05, df = 5 This is the sampling distribution of t that would occur if the null hypothesis were true and µ1 = µ2. When the null hypothesis is true, the observed value will fall in the common zone 95% of the time and it will fall in the rare zone only 5% of the time.