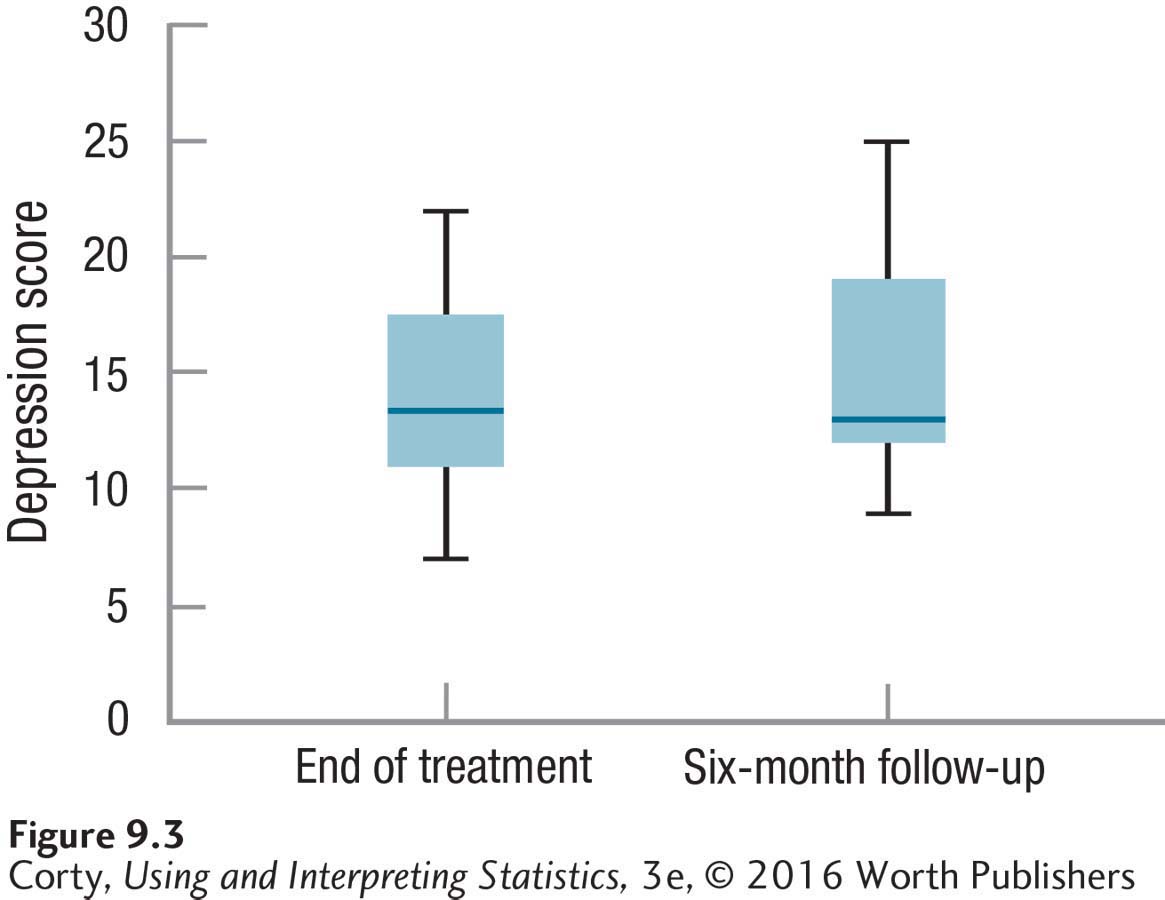
Figure 9.5 Figure 9.3 Box-and-Whisker Plots Showing Depression Level after Treatment and at Six-Month Follow-Up In this graph, there is some increase in the depression level in the six months following treatment. It will take a paired-samples t test to determine if the difference is statistically significant.