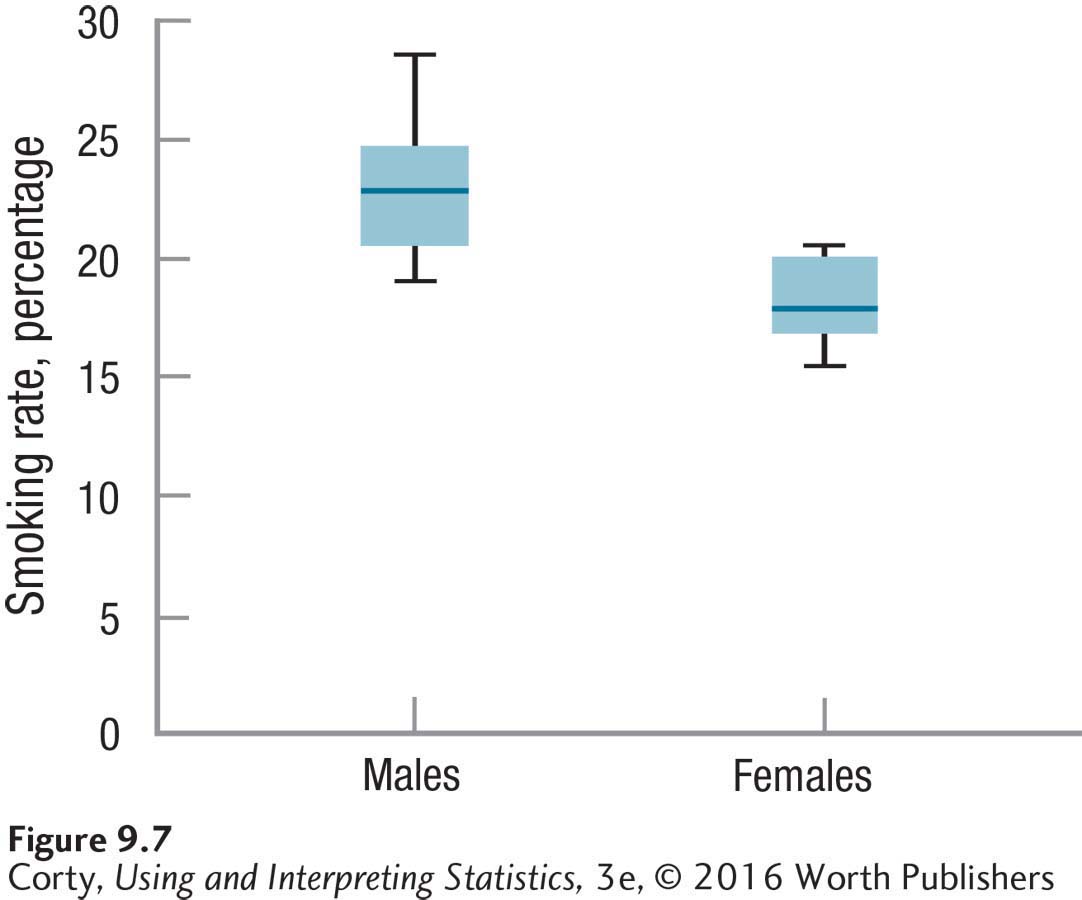
Figure 9.10 Figure 9.7 Smoking Rates for Males and Females in Sample of 10 States In this graph, it appears as if the smoking rate by state is higher for men than for women. However, to make sure the effect can’t be explained by sampling error, hypothesis testing is needed.