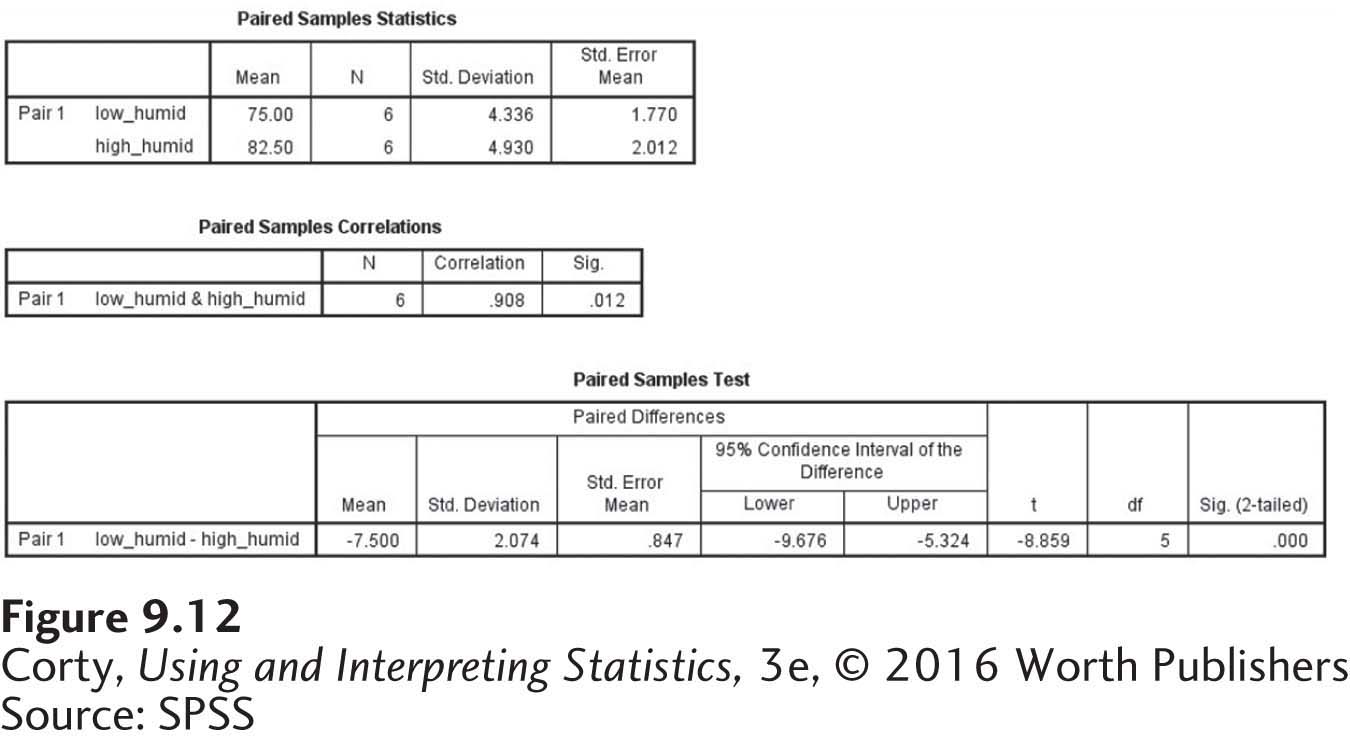
Figure 9.16 Figure 9.12 SPSS Output for a Paired-Samples t Test The top table provides descriptive statistics for the two samples. The bottom table provides the t value, the significance level, and the 95% confidence interval for the difference between the population means. (Ignore the middle table for now.)