16.3 Hypothesis Tests I: Difference Tests
Let’s move from selecting the correct descriptive statistic to selecting the right difference test. Difference tests are the most popular type of hypothesis test used in psychology. t tests and ANOVAs are examples of difference tests. Difference tests are used when cases are sorted into groups that are defined on the basis of an explanatory variable. They are used to answer the question of whether groups differ on some outcome variable. For example, whether people with depression or people with anxiety are more impaired by their disorder would be answered by a difference test.
Difference tests are the go-to tests for experimental and quasi-experimental designs. In experimental designs, the researcher controls the assignment of participants to groups on the basis of the independent variable. With quasi-experimental designs, participants are classified as being in groups on the basis of their naturally occurring status on the grouping variable. In either event, a difference test is used to compare the groups in terms of the dependent variable.
The flowchart in Figure 16.5 shows how to choose the correct difference test to answer a research question. Picking the right test depends on (1) the number of groups of cases, (2) the number of explanatory variables, (3) the type of samples—independent or dependent, and (4) the level of measurement for the dependent variable.
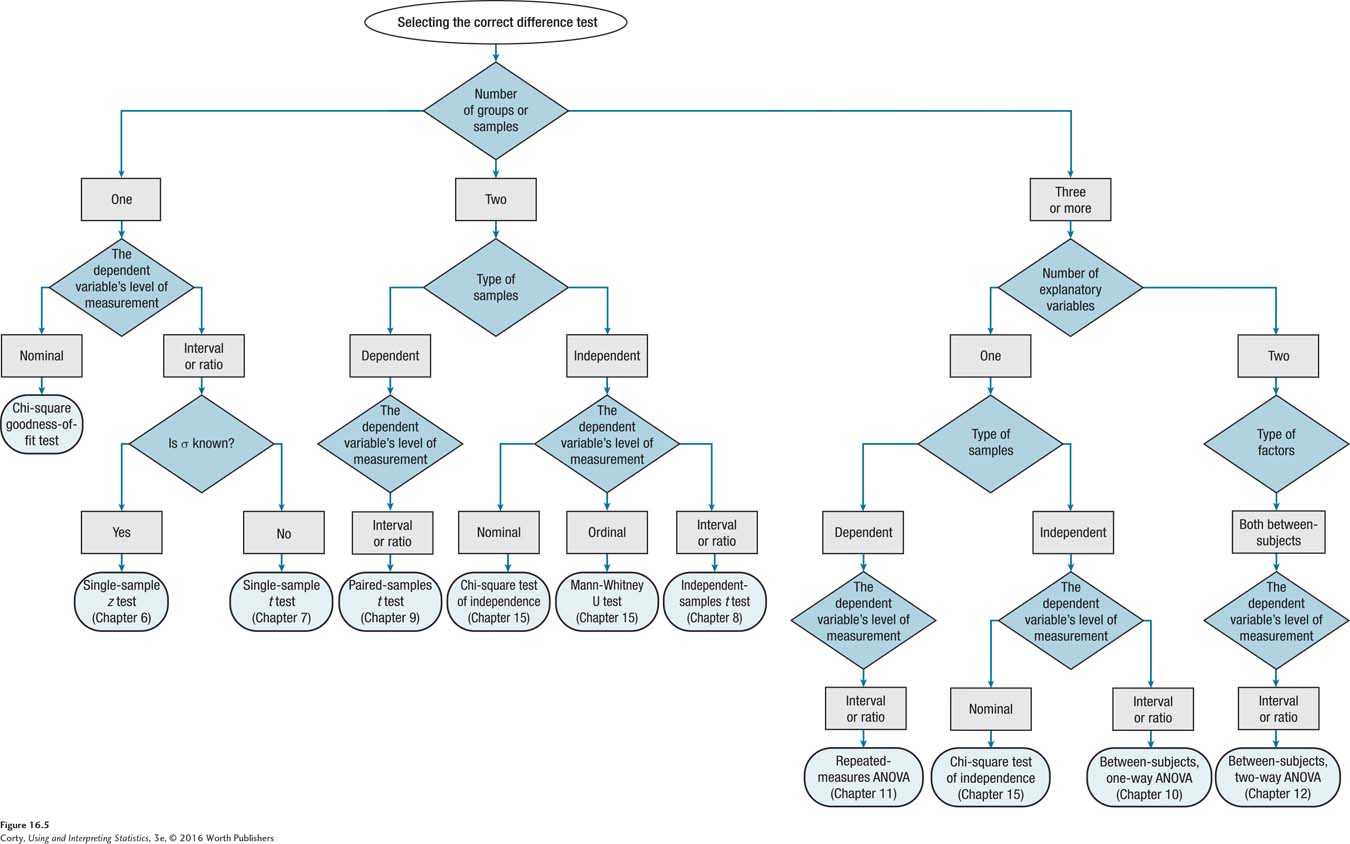
Whether a study is experimental or quasi-experimental, the first decision point involves how many groups of cases there are: one, two, or three or more groups. If just one group exists, then the sample is being compared to a specified value or a population value. The specific test to be used in making that comparison is determined by the dependent variable’s level of measurement.
If there is more than one group, it is important to determine whether the comparison is between just two groups or among three or more groups. This determination leads to the next decision point. When the comparison is between two groups, the next decision point is whether the groups are independent samples or dependent samples (see Chapters 8 and 9 on t tests).
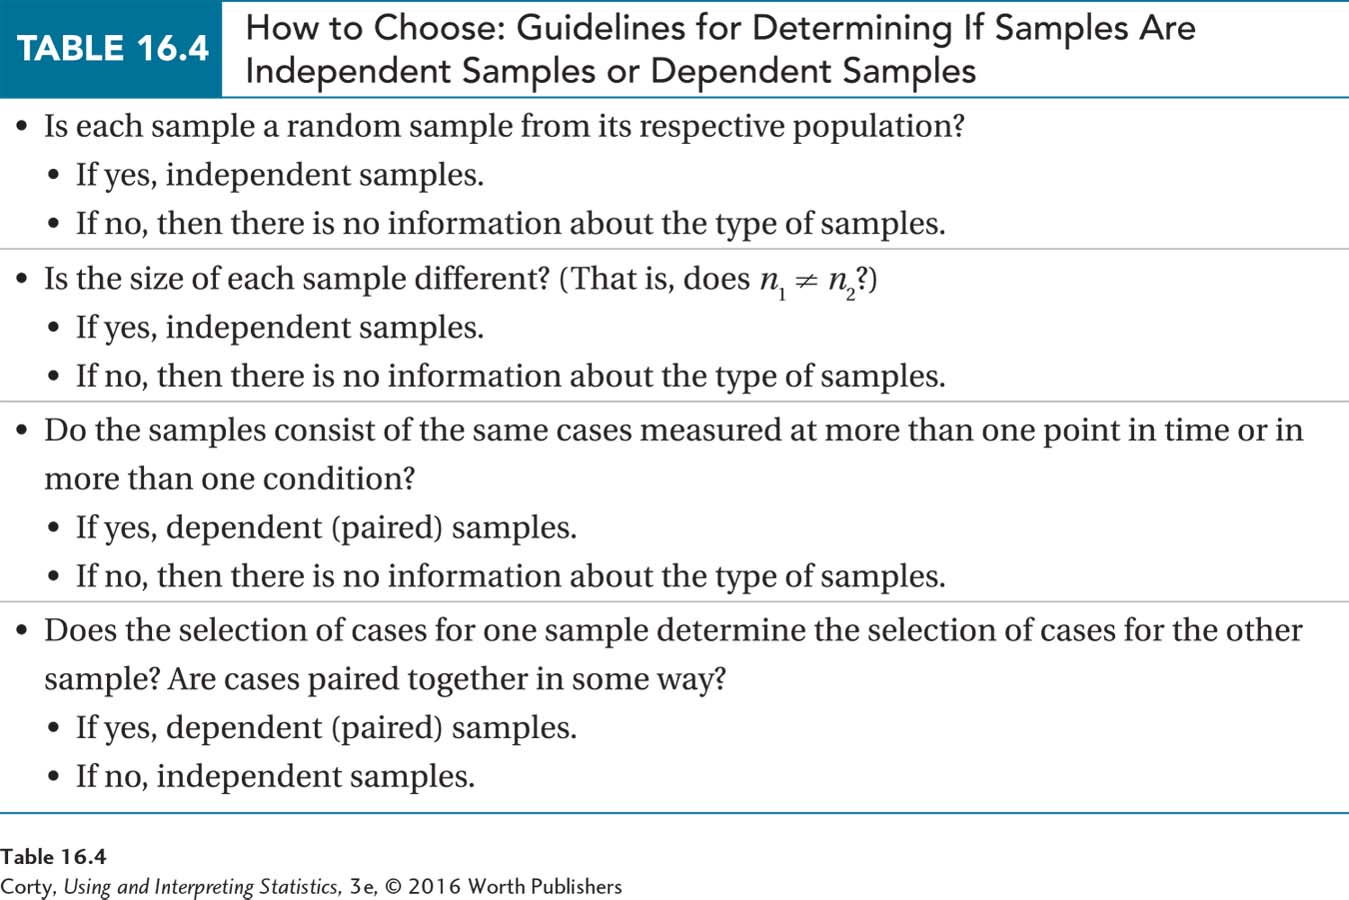
Table 16.4 presents guidelines for determining the type of samples—independent or dependent. Once the type of samples has been determined for a two-sample test, the specific difference test to use depends on the level of measurement for the dependent variable.
When there are three or more samples, the flowchart branches out depending on (1) the number of explanatory variables, (2) whether the samples are independent or dependent, and (3) the dependent variable’s level of measurement.
To see how the flowchart works, imagine a clinical psychologist who wanted to see how the loss of a parent before age 6 affected a child’s adult level of psychological functioning. She obtained a large and representative sample of adults and classified them as belonging to one of four groups: (1) neither parent had died before the child, who is now an adult, was 6 years old; (2) the mother died before the child was 6 years old; (3) the father died before the child was 6 years old; or (4) both parents died before the child was 6 years old. To measure adult psychological functioning, she used an interval-level measure of psychological resilience. What statistical test should she use to find out if the mean level of psychological resilience differs among these four groups? The difference test flowchart, Figure 16.5, will help determine the answer.
The first decision point involves how many groups of cases exist. There was one sample of cases, which was divided into four groups, so proceed down the flowchart path on the far right side for three or more groups.
The next decision point involves how many explanatory variables exist. In this situation, there is one grouping variable, early parental death, that has four levels (none died, mother died, father died, both died).
The next choice point involves the type of samples, dependent or independent. In this example, each case is classified as belonging to only one group and cases are not paired with each other. Who is classified as being in one group has no impact on who is classified as being in one of the other groups. The samples are independent.
The final question to be addressed involves the level of measurement of the dependent variable. The dependent variable, psychological resilience, is measured at the interval level, which leads to the selection of a between-subjects, one-way ANOVA as the appropriate statistical test.
A Common Question
Q What should be done if there is no test listed in the flowchart? For example, what happens if the dependent variable for the early parental loss study was ordinal, not interval?
A The flowcharts here only choose among the statistical tests taught in this book. To find the correct test for a different situation, see the SPSS section at the end of this chapter, or consult a more advanced text.
Worked Example 16.1
For practice choosing the correct difference test, imagine an economist who wanted to investigate whether parents invest equally in their children’s education depending on the children’s birth order. From around the United States, he obtained a sample of families with two (and only two) children in which both children had attended college. His dependent variable was how much money the parents contributed to each child’s college education. Is there a difference in mean parental funding for first-born vs. second-born children?
There are two samples, a sample of first-born children and a sample of second-born children.
The children in the two samples are paired together—they come from the same family—so the samples are dependent samples.
The dependent variable, dollars spent, is a ratio-level variable.
Following the difference test flowchart, Figure 16.5, leads to selecting the paired-samples t test as the correct test to analyze the results.
Practice Problems 16.2
Select the correct statistical test.
16.04 A public health researcher wanted to know if hand washing or hand sanitizer was more effective in removing germs. She randomly assigned visitors at a hospital to wash their hands with soap and water or to use hand sanitizer. She then cultured the visitors’ hands to see how many bacterial colonies there were.
16.05 People who wanted to lose weight were randomly assigned to drink 1 cup, 2 cups, or 3 cups of green tea each day. After three months, each person was weighed to determine how many pounds he or she had lost.
16.06 People from countries with spicy cuisines were matched in terms of age and sex with people from countries with bland cuisines. All participants completed the Willingness to Engage in Risky Behavior Scale. Are people who eat spicy food more likely to engage in risky behavior?