1.4 The Language of Statistics
 StatClips: Statistics IntroductionVideo on LaunchPad
StatClips: Statistics Introduction: Populations, Parameters, Samples, and Sample StatisticsVideo on LaunchPad
Like any discipline, statistics defines words in special ways to make communication easier. The names for different types of studies and levels of measurement have already been covered. Now it is time to learn some more terms that will be used throughout the book.
The subjects in a study are drawn from a population, which is the larger group of cases a researcher is interested in studying. If a psychologist were interested in studying depression, the population could consist of all people in the world with depression. Such a large population may be too unwieldy to study, so the researcher might limit it by adding other criteria such as age (e.g., depression in adults) or a specific diagnosis (e.g., major depression).
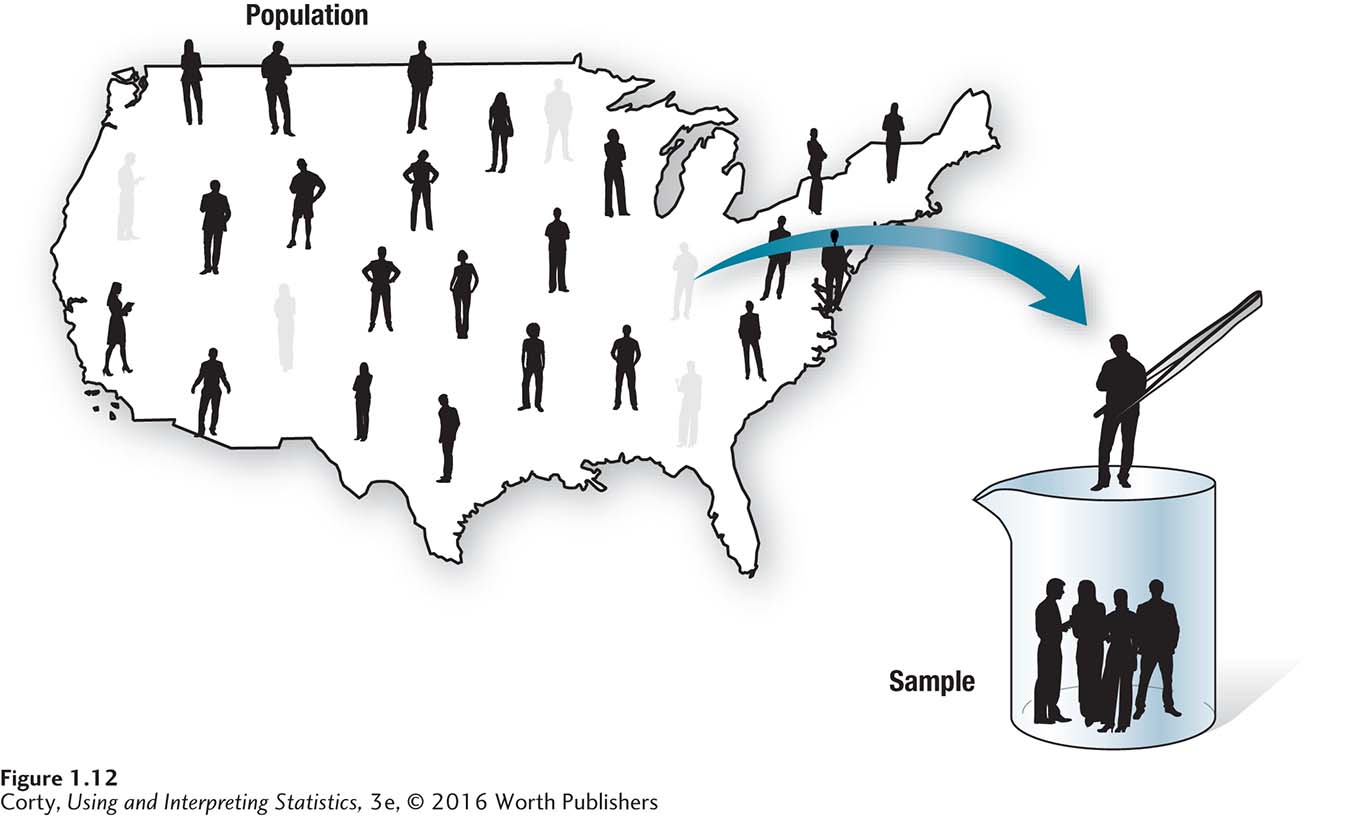
Even if the population is carefully defined (e.g., adult males in industrialized nations who are experiencing a major depression and do not have a substance abuse diagnosis), there is no way that the researcher could find and contact all the people who meet these criteria. As a result, researchers almost always conduct their research on a subset of the population, and this subset is called a sample. A sample is a group of cases that is selected from the population. A sample is always smaller in size than the population, as shown in Figure 1.12. If a sample is an accurate reflection of the larger population, it is called a representative sample.
The data from a sample or population are often reduced to a single number, like an average, in order to summarize the group. This number has a different name depending on whether it is used to characterize a sample or a population. If the number characterizes a sample, it is called a statistic. If the number characterizes a population, it is called a parameter.
The difference between a statistic and a parameter is important, so different abbreviations indicate whether a value refers to a sample or a population. Statisticians use Latin letters to symbolize sample statistics and Greek letters to symbolize population parameters. When a researcher calculates the mean for a sample, it is called a statistic and symbolized by the letter M. For the population, a mean is a parameter and symbolized by the Greek letter mu (pronounced as “mew” and written like a script u, μ).
Statisticians also distinguish between descriptive statistics and inferential statistics. A descriptive statistic is a summary statement about a set of cases. It involves reducing a set of data to some meaningful value in order to describe the characteristics of that group of observations. If someone reported that 37% of his or her class was male, that would be a descriptive statistic.
An inferential statistic uses a sample of cases to draw a conclusion about the larger population. Inferential statistics also involve reducing a set of data to a single meaningful value, but it is being done to make inferences about a population (rather than to describe a sample). In other words, an inferential statistic allows one to generalize from a sample to a population.
For example, one might obtain a sample of students at a college, measure their depression level, and calculate the average depression level. If one stops there and makes a statement like, “The average depression level in the sample of students at the college was 12.75,” that would be a descriptive statistic. But, if one went on and generalized to college students with a statement such as, “College students have, on average, a depression level of 12.75,” that would be an inferential statistic. An inferential statistic is used to draw a conclusion about a larger set of cases.
Practice Problems 1.4
Review Your Knowledge
1.17 What are Greek letters used as abbreviations for? Latin letters?
1.18 What is the name for a statistic that is used to draw a conclusion about a population from a sample?
Apply Your Knowledge
1.19 The athletic director at a college is interested in how well female athletes perform academically. He interviews the women’s softball team, determines what their average GPA is, and reports that the women’s softball team has a GPA of 3.37. (a) Is this a statistic or a parameter? (b) Is this a descriptive or an inferential statistic?
1.20 A demographer is interested in the annual incomes of people who live in apartments. From the Census Bureau, she obtains a representative sample of 2,500 people living in apartments all across the United States and learns their annual incomes. She then reports that the average annual income of apartment dwellers in the United States is $29,983. (a) Does this number come from a sample or a population? (b) Is it a descriptive or an inferential statistic?