Chapter Introduction
3
Measures of
Central Tendency
and Variability
LEARNING OBJECTIVES
Define and know when to calculate three measures of central tendency.
Define variability and know how to calculate four different measures of it.
CHAPTER OVERVIEW
The last chapter explored how to summarize a set of data using a frequency distribution and/or a graph. The current chapter uses descriptive statistics to summarize a whole set of data with just one or two numbers.
The numbers summarize different aspects of a set of scores. One of the numbers describes what statisticians call central tendency, a single value used to represent the typical score in a set of scores. Another number used to summarize a set of data, a measure of variability, summarizes how much variety exists in a set of scores.
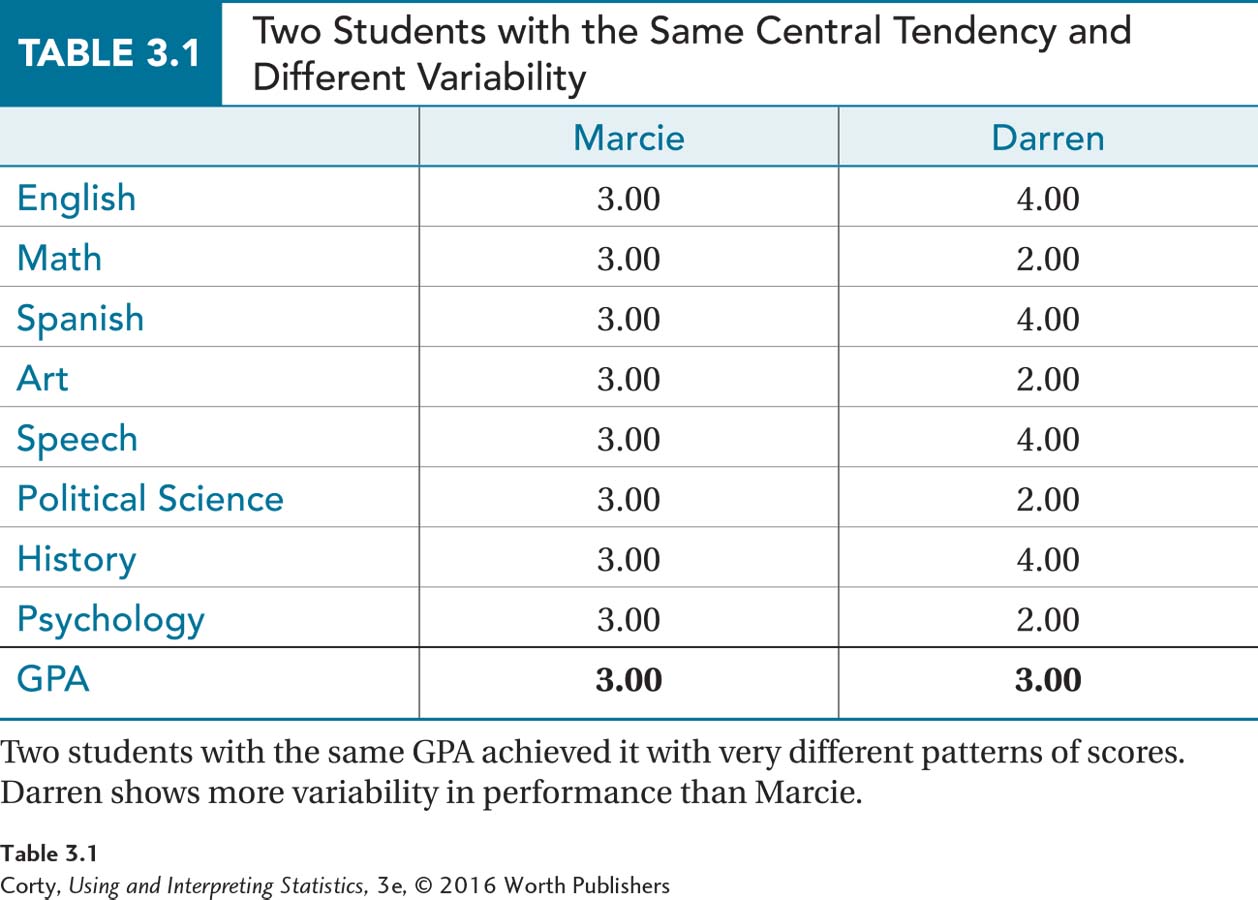
Both measurements—central tendency and variability—are important. Imagine two students with GPAs of 3.00, as seen in Table 3.1. A measure of central tendency, like GPA, gives an overall summary of how well the students are doing academically. Here, both have the same GPA, so the two students look alike—Darren and Marcie are doing equally well in school. Variability, however, provides a different perspective on the students. Marcie achieved her 3.00 average by getting B’s in every course. Darren achieved his 3.00 GPA by getting A’s in half of his classes and C’s in the other half. Both students have the same grade point average, a 3.00, but they differ in variability. Here, variability provides important information. Variability reveals that Marcie is more consistent in her academic work than Darren.