CHAPTER EXERCISES
Answers to the odd-numbered exercises appear in Appendix B.
Review Your Knowledge
3.01 The two dimensions used in this chapter to summarize a set of data are measures of ____ and ____.
3.02 The three measures of central tendency covered in this chapter are ____, ____, and ____.
3.03 Two sets of scores may be alike in central tendency but can still differ in ____.
3.04 The formula for a ____ is X – M.
3.05 The sum of deviation scores equals ____.
3.06 A mean may be influenced by ____, which are extreme scores.
3.07 The median is ____ influenced by outliers than is the mean.
3.08 The median separates the top ____% of scores from the bottom ____% of scores.
3.09 If one has interval or ratio data, the first choice for a measure of central tendency to calculate should be a ____.
3.10 If one has interval or ratio data and the data set is skewed, one should use a ____ as the measure of central tendency.
3.11 If one has interval or ratio data and the data set is multimodal, one should use ____ as the measure of central tendency.
3.12 If one has nominal data, one should use a ____ as the measure of central tendency.
3.13 The range, interquartile range, variance, and standard deviation can only be used with variables measured at the ____ or ____ level.
3.14 The range tells the distance from the ____ score to the ____ score.
3.15 The range is/is not influenced by outliers.
3.16 If the top 25% of scores and the bottom 25% of scores are trimmed off the range, it is called the ____.
3.17 If the interquartile range for student A’s grades is wider than it is for student B’s grades, then student A has ____ variability in his or her grades.
3.18 The interquartile range can be used as a measure of ____ as well as variability.
3.19 There is more variability in a ____ than in a ____.
3.20 Because populations are so ____, it is practically impossible to measure variability in them.
3.21 The ____ is the mean squared deviation score.
3.22 The ____ is the square root of the ____ and tells the average distance by which the raw scores deviate from the mean.
3.23 The variance and standard deviation, unlike the range and the interquartile range, use information from all of the ____.
3.24 The information used from each case, in calculating variance and standard deviation, is its ____ score.
3.25 If scores are ____ clustered around the mean, then there is less variability in that set of scores.
3.26 The average deviation score is not useful as a measure of variability because the ____ of the deviation scores is always ____.
3.27 To use deviation scores to measure variability, statisticians ____ them before summing them.
3.28 ____ is the abbreviation for population variance.
3.29 ____ is the abbreviation for population standard deviation.
3.30 If the standard deviation is small, then the scores fall relatively close to the ____.
3.31 Sample values of variance and standard deviation are ____, so they are better approximations of the ____ values.
3.32 The abbreviation for sample variance is ____; for sample standard deviation, it is ____.
3.33 The first step in calculating a sample variance is to calculate a ____ for each case.
3.34 If s for one set of data is 12.98 and it is 18.54 for a second set of data, then the first set of data has ____ variability than the second.
Apply Your Knowledge
Selecting and calculating the appropriate measure of central tendency
3.35 An industrial/organizational psychologist measured the number of errors seven research participants made in a driving simulator while talking on their cell phones. Here are her data: 12, 6, 5, 4, 4, 3, and 1.
3.36 A cognitive psychologist at a state university noted whether her research participants had been raised in a non–English-speaking household (0), an English-only–speaking household (1), or a multilingual, including English, household (2). Here are her data: 0, 0, 1, 1, 1, 1, 1, 1, 1, 1, 1, 1, 1, 2, 2, 2, and 2.
3.37 A cardiologist wanted to measure the increase in heart rate in response to pain. She directed healthy volunteers to immerse their dominant hands into a bucket of ice water for 1 minute. Here are the increases in heart rate for her participants: 20, 23, 25, 19, 28, and 24.
3.38 An educational psychologist was teaching a graduate seminar with seven students. He was curious to know if the amount of sleep had an impact on performance. On the first exam, he asked how many hours the students had slept the night before. Here are the data he obtained: 8, 9, 7, 6, 8, 4, and 7.
Calculating the mean
3.39 Given the following ratio-level numbers, calculate the mean: 80, 88, 76, 65, 59, and 77.
3.40 Given the following interval-level numbers, calculate the mean: 0.13, 0.28, 0.42, 0.36, and 0.26.
Calculating median and mode
3.41 Find the median and the mode for the following data: 65, 66, 66, 70, 71, 72, 72, 72, 78, 83, 85, 86, 87, 87, 88, 88, 92, 93, 95, 95, 99, 100, 102, 102, 102, 102, 102, 103, 104, 108, 111, 113, 118, 119, 119, 119, 121, 121, 122, 128, 130, 131, 134, 136, 138, 139, and 145.
3.42 Find the median and the mode for the following data: 30, 30, 32, 33, 35, 35, 38, 41, 42, 43, 45, 45, 48, 49, 50, 50, 50, 51, 52, 53, 53, 53, 53, 53, 53, 55, 55, 58, 59, 61, 62, 62, 64, 65, 66, 66, 67, 68, 70, 71, 71, 72, 72, 73, 73, 75, 76, 78, 79, and 80.
Range and interquartile range
3.43 Here is a listing, to the nearest million dollars, of the total payrolls for the 30 Major League baseball teams in 2009.
Calculate the range.
Which is a better measure of variability to report, the range or the interquartile range? Why?
| 201 | 100 | 78 | 63 |
| 149 | 99 | 75 | 62 |
| 135 | 97 | 74 | 60 |
| 122 | 96 | 74 | 49 |
| 115 | 83 | 71 | 44 |
| 114 | 82 | 68 | 37 |
| 113 | 81 | 67 | |
| 103 | 80 | 65 |
3.44
Find the range for the data in Exercise 3.41.
Which is a better measure of variability to report, the range or the interquartile range? Why?
Calculating variability
3.45 A researcher obtained a sample from a population and measured an interval-level variable on each case. Here are the values he obtained: 47, 53, 67, 45, and 38. He found M = 50.00. Find the following: (a) N, (b) ∑ (X – M), (c) ∑ (X – M)2.
3.46 Given this data set (12, 9, 15, 13, and 11) with a mean of 12.00, find the following: (a) N, (b) ∑ (X – M), (c) ∑ (X – M)2.
3.47 A clinical psychologist took a sample of four people from the population of people with anxiety disorders and gave them an interval-level anxiety scale. Their scores were 57, 60, 67, and 68 with a mean of 63.00. Calculate s2.
3.48 A nurse practitioner took a sample of five people from the population of people with high blood pressure and measured their systolic blood pressures as 140, 144, 148, 156, and 162 with a mean of 150.00. Calculate s2.
3.49 An interval-level measure was obtained on a sample of four cases. Their raw scores were 21, 18, 12, and 9. Calculate s2.
3.50 An interval-level measure was obtained on five cases. Their raw scores were 108.5, 95.5, 98.0, 112.0, and 112.5. Calculate s2.
3.51 If s 2 = 6.55, what is s?
3.52 If s 2 = 256.38, what is s?
3.53 Calculate s for these data, which have a mean of 37.20: 24, 36, 42, 50, and 34.
3.54 Calculate s for these data, which have a mean of 3.30: 1.4, 2.2, 4.5, 4.1, and 4.3.
Expand Your Knowledge
3.55 A librarian measured the number of pages in five books. No two had the same number of pages. Here are the results from four of the books: 150, 100, 210, and 330. Using the counting method, he calculated the median for all five books as 150. In the list below, what is the largest value possible for the number of pages in the fifth book?
99
101
125
149
151
185
209
211
270
329
331
It would be possible to determine this, but the value is not listed above.
It is not possible to determine this from the information in the question.
3.56 A teacher has a set of 200 numbers, where the mean is dramatically greater than the median. What does this suggest about the shape of the distribution?
The distribution is probably normal.
The distribution is probably bimodal.
The distribution is probably flat.
The distribution is probably unusually peaked.
The distribution is probably negatively skewed.
The distribution is probably positively skewed.
Comparing the mean to the median provides no information about a distribution’s shape.
3.57 A researcher has a set of positive numbers. No numbers are duplicates. The mean is greater than the median. Which of the following statements is true?
It is likely that more of the numbers are greater than the mean than are less than the mean.
It is likely that more of the numbers are less than the mean than are greater than the mean.
It is likely that more of the numbers are greater than the median than are less than the median.
It is likely that more of the numbers are less than the median than are greater than the median.
None of these statements is likely true.
3.58 Select the appropriate measure of central tendency for each scenario:
A researcher obtains a sample of men who have been married for 7 years and asks them to rate their levels of marital happiness on an ordinal scale that ranges from –7 (extremely unhappy) to + 7 (extremely happy).
An anatomist obtains a sample of athletes that consists of 75 jockeys (who are extremely short) and 75 basketball players (who are extremely tall). She measures the height of all 150 and wants to report the overall average.
A social studies teacher, with a classroom of students who have roughly the same level of ability, administered a final exam of multiple-choice questions on the social studies facts they had learned.
An astronomer classifies celestial objects as 1 (stars), 2 (planets), 3 (dwarf planets), 4 (asteroids), 5 (moons), 6 (comets), 7 (meteoroids), and 8 (other). He wants to report the average celestial object in a sample of the universe.
A college psychology program has 12 faculty members. One of them is a full professor, three are associate professors, and eight are assistant professors. (Full professors have substantially higher salaries than associate professors, who have substantially higher salaries than assistant professors.) The chair of the program wants to report the average salary of the 12 faculty members.
3.59 A researcher takes two samples, one with N = 10 and the other with N = 100, from the same population.
Which sample, N = 10 or N = 100, will have to correct s 2 less in order to approximate the population variance?
Why is it sensible that Equation 3.6 works this way?
3.60 A meteorologist measured the temperature every 2 hours for a day in January and for a day in June. Here are the temperatures, in degrees Fahrenheit, for the January day: 23, 22, 21, 21, 23, 27, 28, 31, 32, 32, 30, and 26. The June temperatures were: 56, 56, 59, 62, 64, 67, 73, 75, 77, 76, 75, and 74. On which day were the temperatures more varied? Support the conclusion by calculating a measure of variability.
SPSS
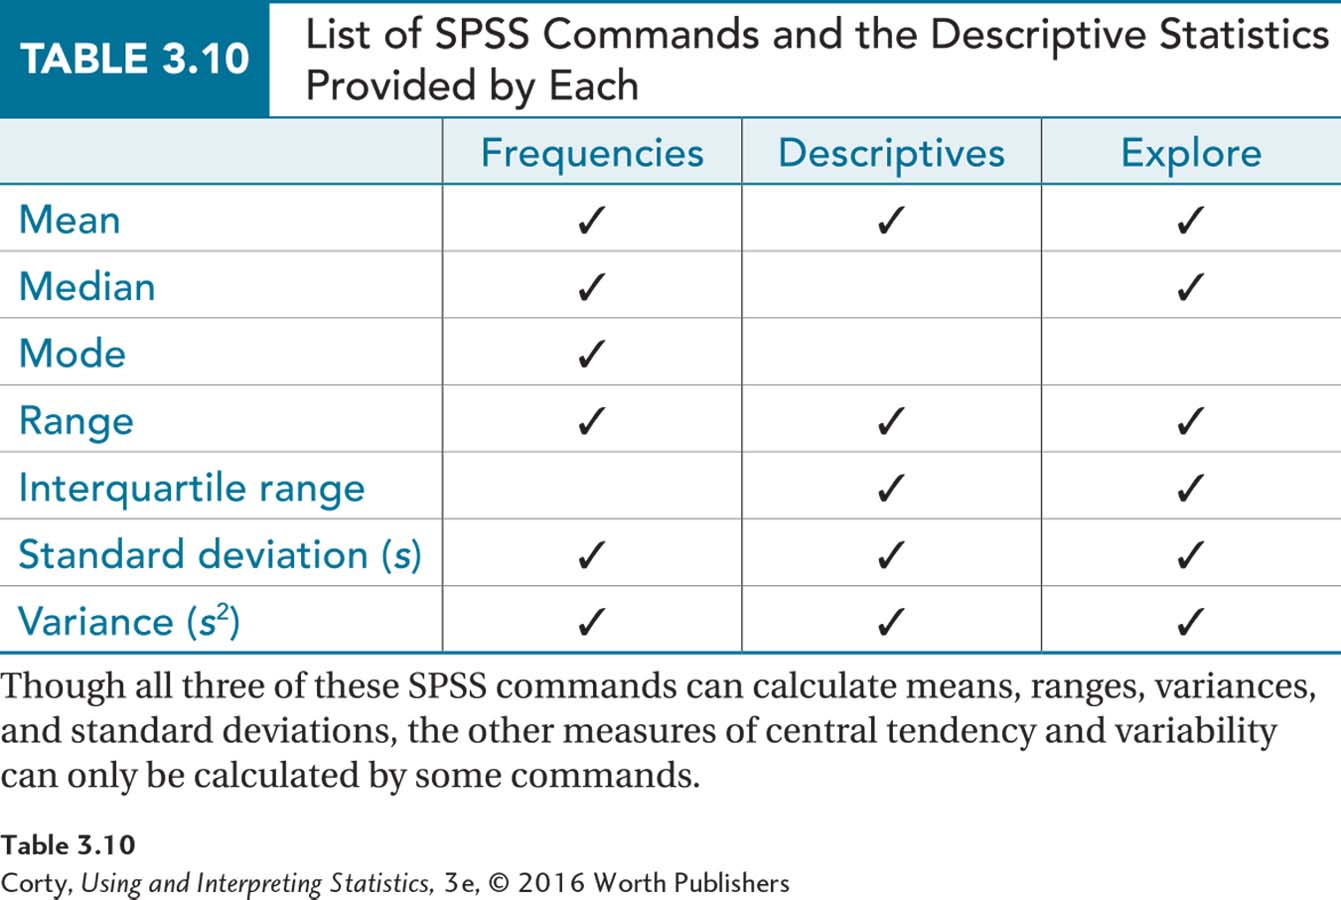
SPSS has multiple ways to calculate central tendency and variability. The “Frequencies,” “Descriptives,” and “Explore” commands all provide some measures of central tendency and variability, but they differ in what they provide. Table 3.10 shows which SPSS command provides which measures of central tendency and variability.
No matter which command one chooses—Frequencies, Descriptives, or Explore—they all start the same way, under the “Analyze/Descriptive Statistics” drop-down menu. This is illustrated in Figure 3.10.
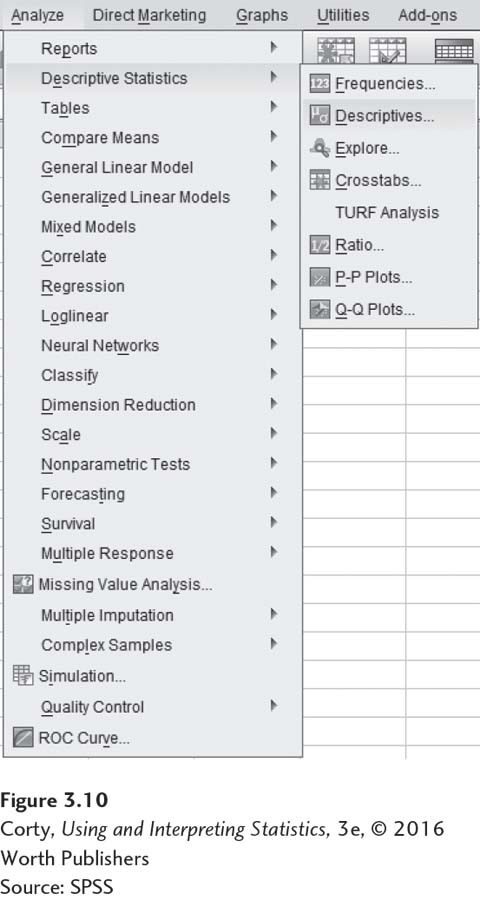
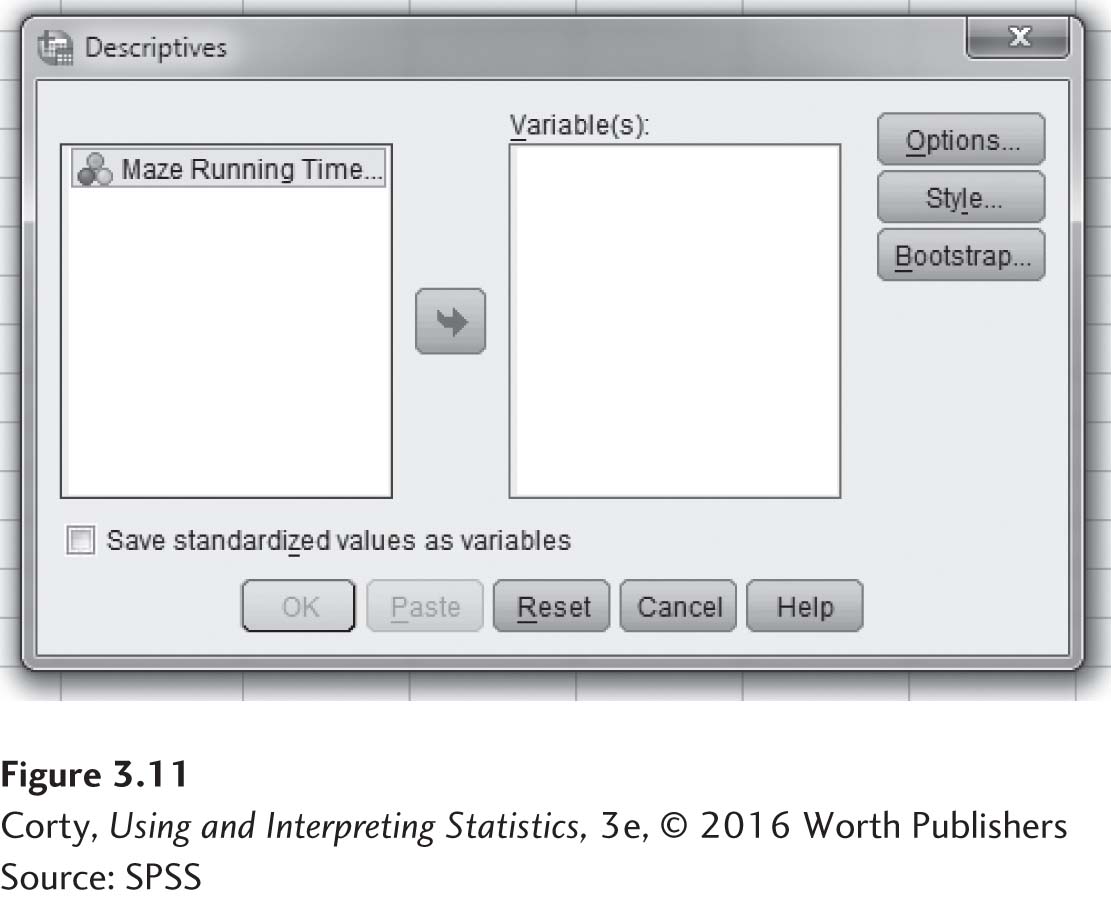
Figure 3.11 shows the initial screen for the Descriptives command. The arrow key is used to move a variable, here “Maze Running Time,” from the box on the left to the “Variable(s)” box.
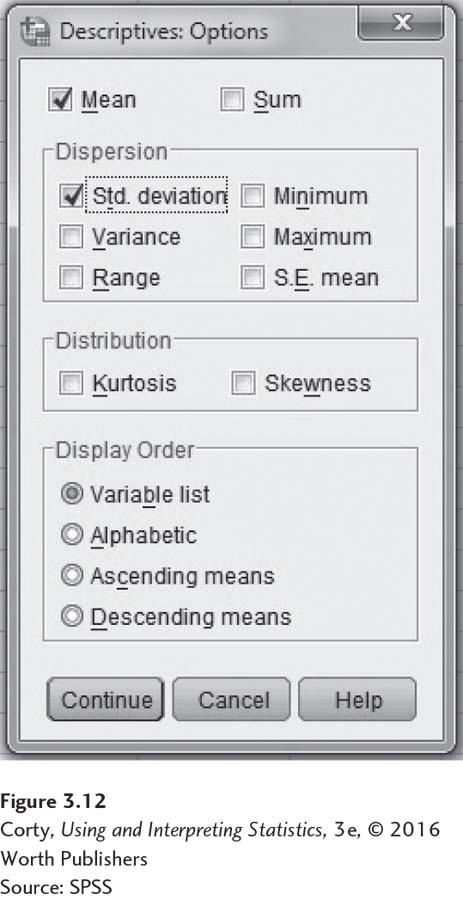
Clicking on the “Options” button in Figure 3.11 opens up the menu seen in Figure 3.12. Here, select the statistics for SPSS to calculate.
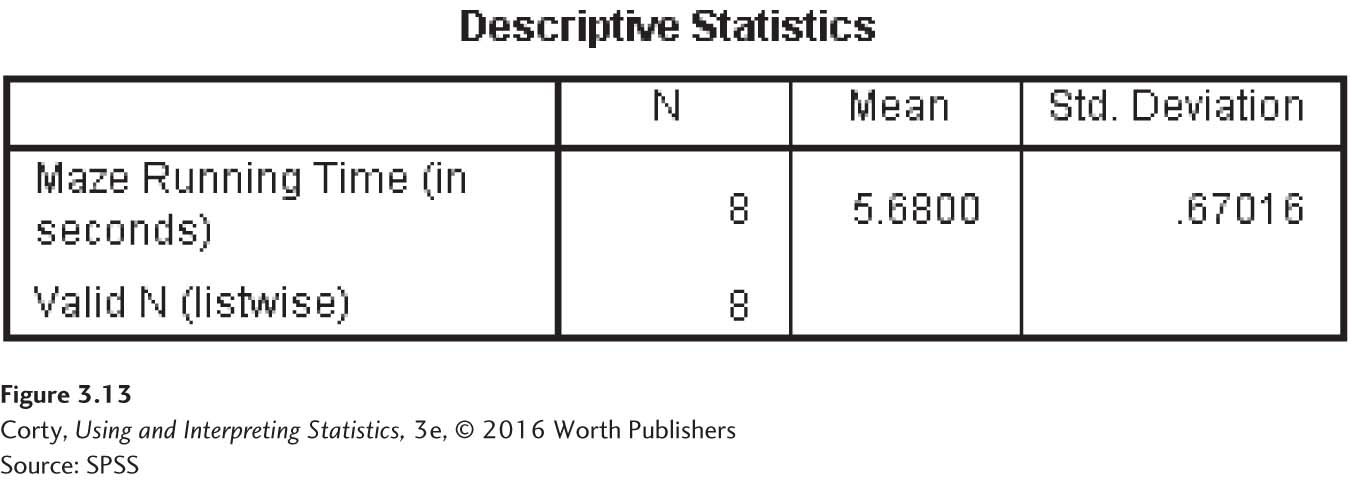
For an example of the output produced by SPSS, see Figure 3.13. Only the mean and the standard deviation were requested and this is all that was calculated.