CHAPTER EXERCISES
Answers to the odd-numbered exercises appear in Appendix B.
Review Your Knowledge
4.01 A standard score is a ____ score expressed in terms of how many standard deviations it is away from the mean.
4.02 ____ is another term for standard score.
4.03 To calculate a z score, one needs to know the raw score, the ____, and the ____.
4.04 A positive z score means the score is ____ the mean; a negative z score means the score is ____ the mean.
4.05 If a raw score is right at the mean, it has a z score of ____.
4.06 The sum of z scores for a data set is ____.
4.07 Given a z score, it is possible to turn it into a raw score as long as one knows the sample ____ and ____.
4.08 The normal curve is symmetrical, has the highest point in the ____, and has frequencies that ____ as one moves away from the midpoint.
4.09 Because the normal curve is symmetric, the midpoint is also the ____ and the ____.
4.10 In a normal curve, 34.13% of the cases fall from the mean to ____ above the mean.
4.11 As one moves away from the mean in a normal distribution, the percentage of cases that fall in each standard deviation ____.
4.12 Within 2 standard deviations of the mean in a normal distribution, about ____% of the cases fall.
4.13 In a normal distribution, it is ____ to have a z score that is greater than 3.
4.14 Three numbers that are good to remember for estimating areas in the first 3 standard deviations of a normal distribution are ____, ____, and ____.
4.15 The normal distribution is a naturally occurring distribution that is the result of ____ processes.
4.16 Most psychological variables are considered to be ____.
4.17 Appendix Table 1 slices the normal distribution into segments that are ____ z score units wide.
4.18 The area that falls above a positive z score is the same as the area that falls ____ a negative z score.
4.19 The area that falls from the mean to a positive z score is ____ as the area from the mean to the same value as a negative z score.
4.20 The area that falls from the mean to a negative z score can’t exceed ____%.
4.21 The area that falls below a negative z score will always be ____ 50%.
4.22 One can use the z score table in reverse, to find a ____ when given a percentile rank.
4.23 A percentile rank tells the percentage of cases whose scores are ____ a given level.
4.24 In a normal distribution, the percentile rank at the ____ is 50.
4.25 Statistical conclusions involve ____.
4.26 ____ concerns how likely an outcome is to occur.
4.27 Probability is defined as the number of ways a specific outcome can occur divided by ____.
4.28 If two outcomes are ____, then only one outcome can occur at a time.
4.29 Probability can be reported as a ____, a ____, or a ____.
4.30 If two outcomes are ____, then what the first outcome is has no impact on what the second outcome is.
4.31 The highest possible probability for an outcome is ____ and the lowest possible probability is ____.
4.32 If 45% of the scores fall in a certain section of the normal distribution, then p = _____that a case selected at random from the population would have a score that falls in that section.
4.33 Statisticians usually think of something that has a probability of _____as rare and something with a probability of .95 as________.
4.34 The middle 16% of scores in a normal distribution consist of ____% just above the mean and ____% just below the mean.
4.35 The extreme 6% of scores in a normal distribution consist of ____% in each tail of the distribution.
4.36 ____ is a very important number in statistics.
Apply Your Knowledge
Calculating standard scores
4.37 If M = 7, s = 2, and X = 9.5, what is z?
4.38 If X = 17.34, s = 5.45, and M = 24.88, what is z?
Calculating raw scores
4.39 If z = 1.45, s = 3.33, and M = 12.75, what is X?
4.40 If s = 25, M = 150, and z = –0.75, what is X?
Calculating z scores
4.41 If John’s score on an IQ test is 73, what is his score as a z score? (For this and subsequent IQ questions, use a mean of 100 and a standard deviation of 15.)
4.42 If Ebony’s score on an IQ test is 113, what is her score as a z score?
Calculating raw scores
4.43 Chantelle’s score on an IQ test, expressed as a z score, is 0. What was her score?
4.44 Sven’s score on an IQ test, expressed as a z score, is–.38. What was his score?
Comparing scores
4.45 Hillary’s score on the math subtest of the SAT was 620. On a spelling test (M = 60, s = 15), she got a 72. Is she better at math or spelling? (On subtests of the SAT, the mean is 500 and the standard deviation is 100.)
4.46 Jong-Il was feeling depressed and anxious. His therapist gave him a depression test (M =10, s = 3, higher scores mean more depression) and an anxiety inventory (M = 80, s = 25, higher scores mean more anxiety). His score was a 15 on the depression test and a 110 on the anxiety inventory. Is Jong-Il more depressed than anxious, or more anxious than depressed?
Finding the area above, below, or to a z score
4.47 What percentage of scores in a normal distribution fall at or above a z score of 1.34?
4.48 What percentage of cases in a normal distribution fall at or below a z score of 2.34?
4.49 What percentage of cases in a normal distribution fall at or above a z score of –0.85?
4.50 What percentage of scores in a normal distribution fall at or below a z score of –2.57?
4.51 What percentage of scores in a normal distribution fall from the mean to a z score of –1.96?
4.52 What percentage of cases in a normal distribution fall from the mean to a z score of 2.58?
4.53 The mean diastolic blood pressure in the United States is 77, with a standard deviation of 11. If diastolic blood pressure is normally distributed and a diastolic blood pressure of 90 or higher is considered high blood pressure, what percentage of Americans have high diastolic blood pressure?
4.54 The average American male is 5′ 9″. The standard deviation for height is 3″. If a basketball coach only wants to have American men on his team who are at least 6′ 6″, what percentage of the U.S. male population is eligible for recruitment?
Solving for percentile rank
4.55 If z = –2.12, what is the score as a percentile rank?
4.56 What is the percentile rank for a z score of 1.57?
4.57 If Gabrielle’s score on an IQ test is 113, what is her score as a percentile rank?
4.58 Werner’s score on an SAT subtest was 480. What is his score as a percentile rank?
Moving from percentile rank to raw score
4.59 Justin’s score as a percentile rank on an SAT subtest was 88.5. What is his score on the SAT subtest?
4.60 Assume systolic blood pressure is normally distributed, with a mean of 124 and a standard deviation of 16. Sarita’s systolic blood pressure, as a percentile rank, is 20. What is her systolic blood pressure?
Calculating probabilities
4.61 If there are 28 students in a classroom and 18 of them are boys, what is the probability—if a student is picked at random—of selecting a boy?
4.62 Paolo, a kindergarten student was given a pack of colored construction paper with 10 pages each of red, orange, yellow, green, blue, indigo, violet, black, and white. His favorite color is green. What is the probability, if he selects a page at random, of picking a green one?
Finding standard scores for middle and extreme sections of the normal curve
4.63 What are the z scores associated with the middle 10% of scores?
4.64 What are the z scores associated with the middle 54% of scores?
4.65 What are the IQ scores associated with the middle 84% of scores?
4.66 What are the IQ scores associated with the middle 61% of scores?
4.67 What are the z scores associated with the extreme 4% of scores?
4.68 What are the z scores associated with the extreme 18% of scores?
4.69 What are the SAT subtest scores associated with the extreme 15% of scores?
4.70 What are the SAT subtest scores associated with the extreme 8% of scores?
Finding probabilities
4.71 What is the probability, for a score picked at random from a normal distribution, that it falls at or above 3 standard deviations above the mean.
4.72 What is the probability, for a score picked at random from a normal distribution, that it falls at or below 2.7 standard deviations below the mean.
4.73 What is the probability, for a score picked at random from a normal distribution, that it falls within .38 standard deviations of the mean.
4.74 What is the probability, for a score picked at random from a normal distribution, that it falls within 2.1 standard deviations of the mean?
4.75 What is the probability, for a score picked at random from a normal distribution, that it does not fall within half a standard deviation of the mean?
4.76 What is the probability, for a score picked at random from a normal distribution, that it falls at least 4 standard deviations away from the mean?
Defining common and rare
4.77 A researcher decides to call something rare if it should happen no more than 10% of the time. What z scores should she use as cut-off scores?
4.78 Another researcher decides to call something rare if it should happen no more than 1% of the time. What z scores should he use as cut-off scores?
4.79 Dr. Noyes wants his rare zone to cover an area with a probability of .05. He would like this whole area to be on the positive side of the normal curve. What z score will be the cut-off for this area?
4.80 Dr. Hicks will call something rare if it happens less than or equal to 3% of the time and is greater than the mean. Expressed as a z score, what is the cut-off score?
Expand Your Knowledge
4.81 What is the standard deviation of a set of z scores?
4.82 Answer this without consulting Appendix Table 1. In a normal distribution, does a higher percentage of scores fall between z scores of 1.1 and 1.2, or between z scores of 2.1 and 2.2?
1.1 and 1.2
2.1 and 2.2
The percentages are the same.
This can’t be answered without consulting Appendix Table 1.
4.83 A researcher obtained a set of scores and has made a frequency polygon for the distribution. The distribution is symmetric, has the highest percentage of scores occurring at the midpoint, and the frequency of scores decreases as it moves away from the midpoint. The distribution is which of the following?
Normally distributed
Not normally distributed
May be normally distributed
Not enough information to tell
4.84 Marilyn vos Savant claims that her IQ was once measured at 228 and that she is the smartest person in the world. (vos Savant is a real person and writes a weekly column for Parade magazine.) Let’s assume that she took a standard IQ test. How credible is her claim that her IQ is 228?
4.85 A researcher has a sample of five cases. She has used the sample mean and sample standard deviation to calculate z scores. Four of the z scores are 0.50, 1.00, 1.50, and 2.00. What is the missing z score?
4.86 A researcher wants to study people who are very jealous. She believes that jealousy is normally distributed. She uses a jealousy scale that has a mean of 75 and a standard deviation of 25. She administers the jealousy scale as a screening device to a large group of people. For her study, she will only select people with scores of 125 or higher. How many people will she need to screen in order to end up with 50 people in her sample?
4.87 Assume that there is an animal intelligence test. A psychologist administers it to a representative sample of cats and a representative sample of dogs. Both species turn out to be, on average, equally smart. (That is, MDogs = MCats.) But, more variability occurred in the IQs of dogs than cats. (That is, sDogs > sCats.) If we consider animals with IQs above 110 to be “geniuses,” will there be more genius cats or more genius dogs?
4.88 If a person is selected at random, what is the probability that he is in the top 7% of the world in terms of height?
4.89 A scale to measure perseverance has been developed. Perseverance is normally distributed and scores on the measure range from 15 to 45. It is very, very rare that anyone scores lower than 15 or higher than 45. What are the scale’s mean and standard deviation?
4.90 What percentage of cases in the normal distribution have z scores in the range from 1.25 through 1.75?
SPSS
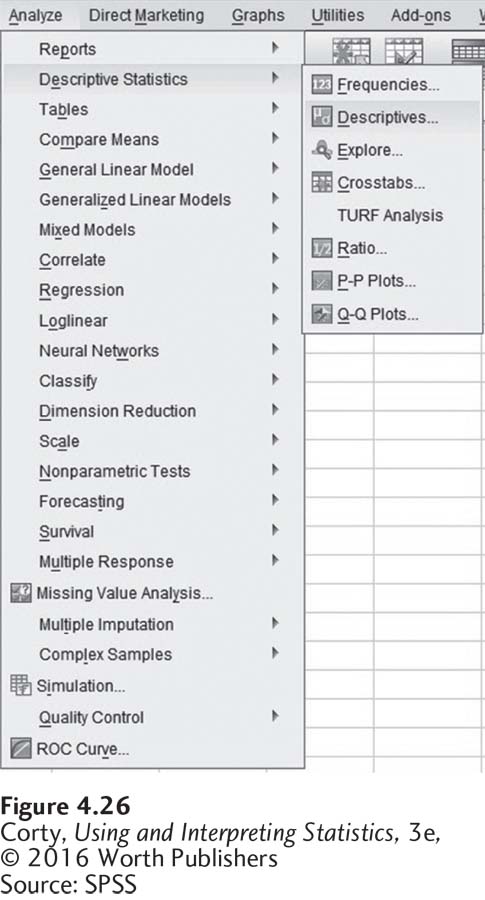
SPSS doesn’t do a lot with z scores or percentile ranks. It does, however, offer a way of converting raw scores to z scores and saving them in the data file so that they can be used in other analyses. To do so, go to the menu under “Analyze,” then “Descriptive Statistics,” and finally “Descriptives” as seen in Figure 4.26.
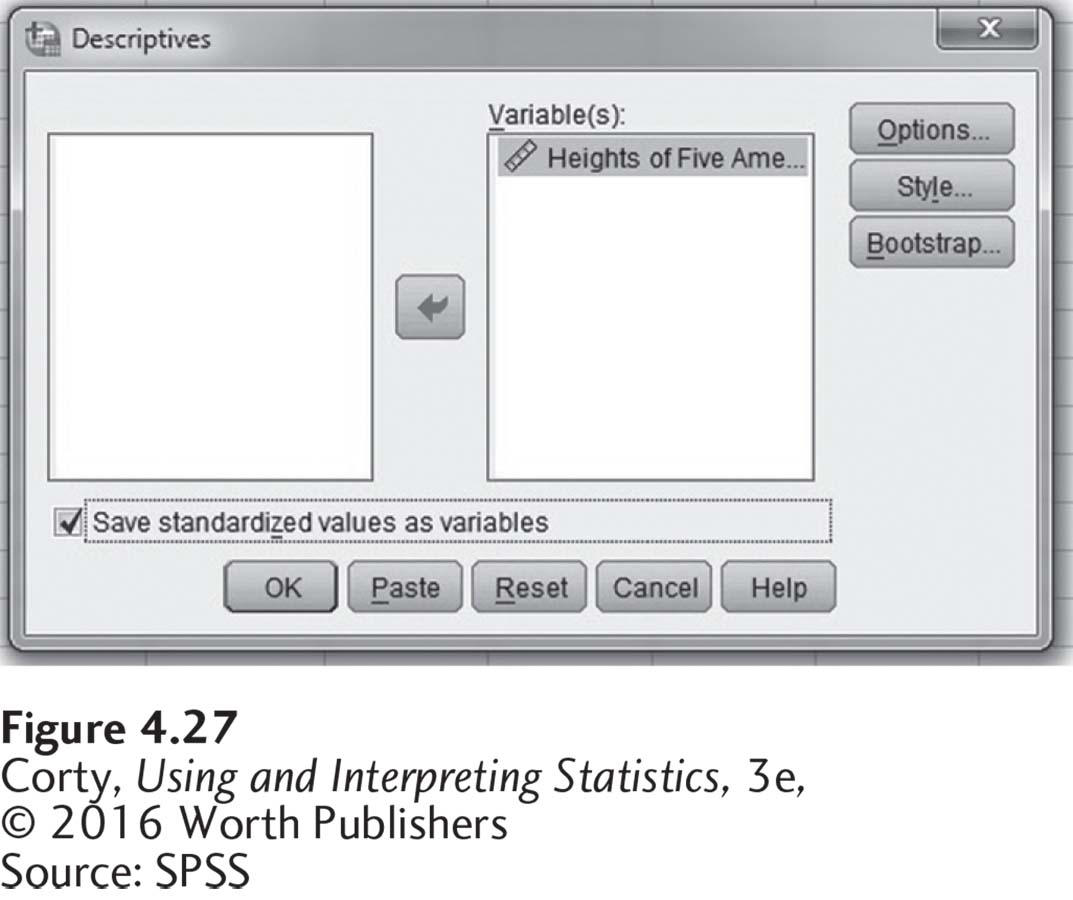
Clicking on Descriptives opens up the menu seen in Figure 4.27. Notice that the variable “height” has already been moved to the “Variable(s)” box and that the box for “Save standardized values as variables” has been checked. Clicking “OK” starts the analysis.
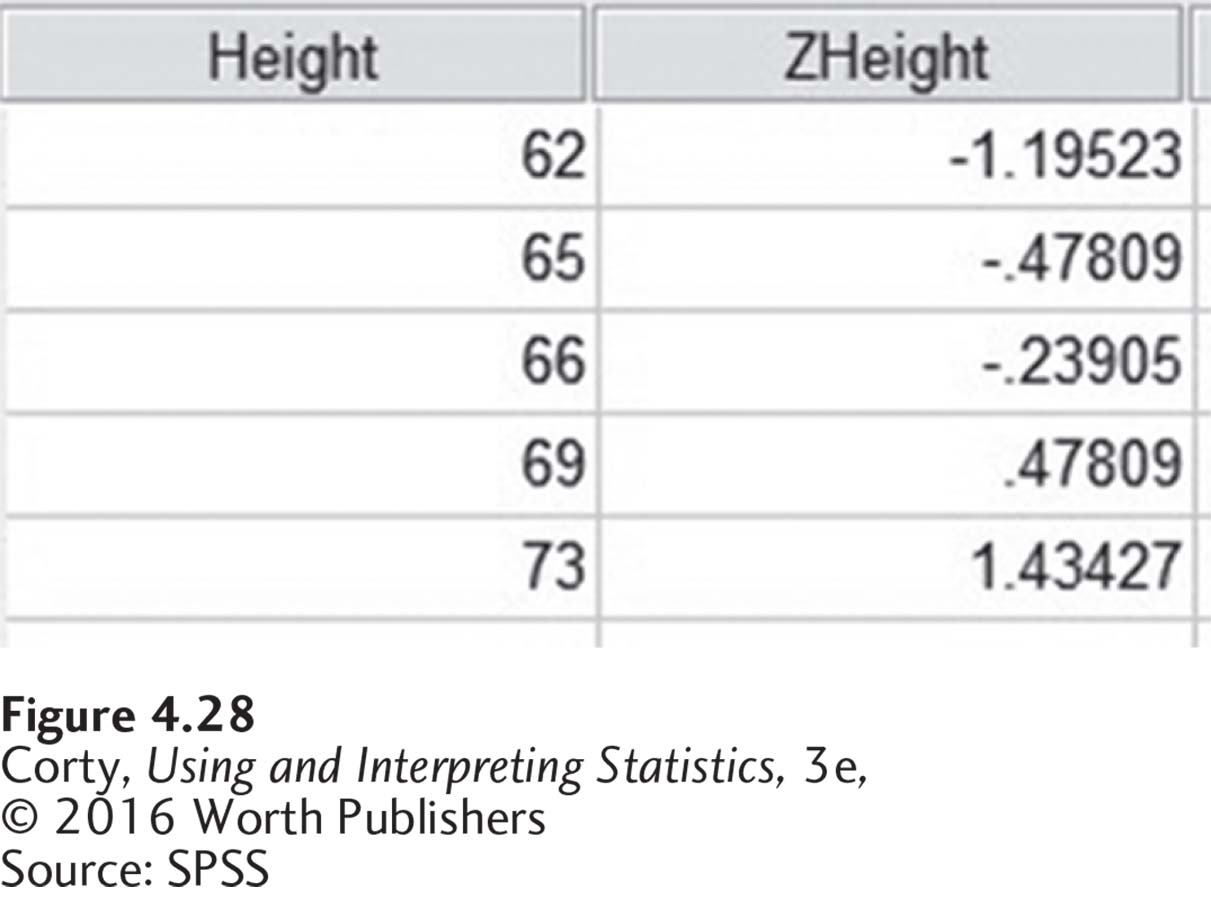
Look at Figure 4.28, which shows the data editor for the demographer’s sample of five Americans. Notice that there are two variables listed: height and Zheight. Zheight is the name assigned to the z score for height by SPSS. The z scores that SPSS calculates carry more decimal places throughout the calculations, but they match up well to the ones found for these data earlier in this chapter.