5.1 Sampling and Sampling Error
 StatClips: Data and SamplingVideo on LaunchPad
Let’s start by reviewing some terminology from Chapter 1. A population is the larger group of cases a researcher is interested in studying, and a sample is a subset of cases from the population. Samples are used in research because populations are usually large, and it is impractical to study all members of the population.
Types of Samples
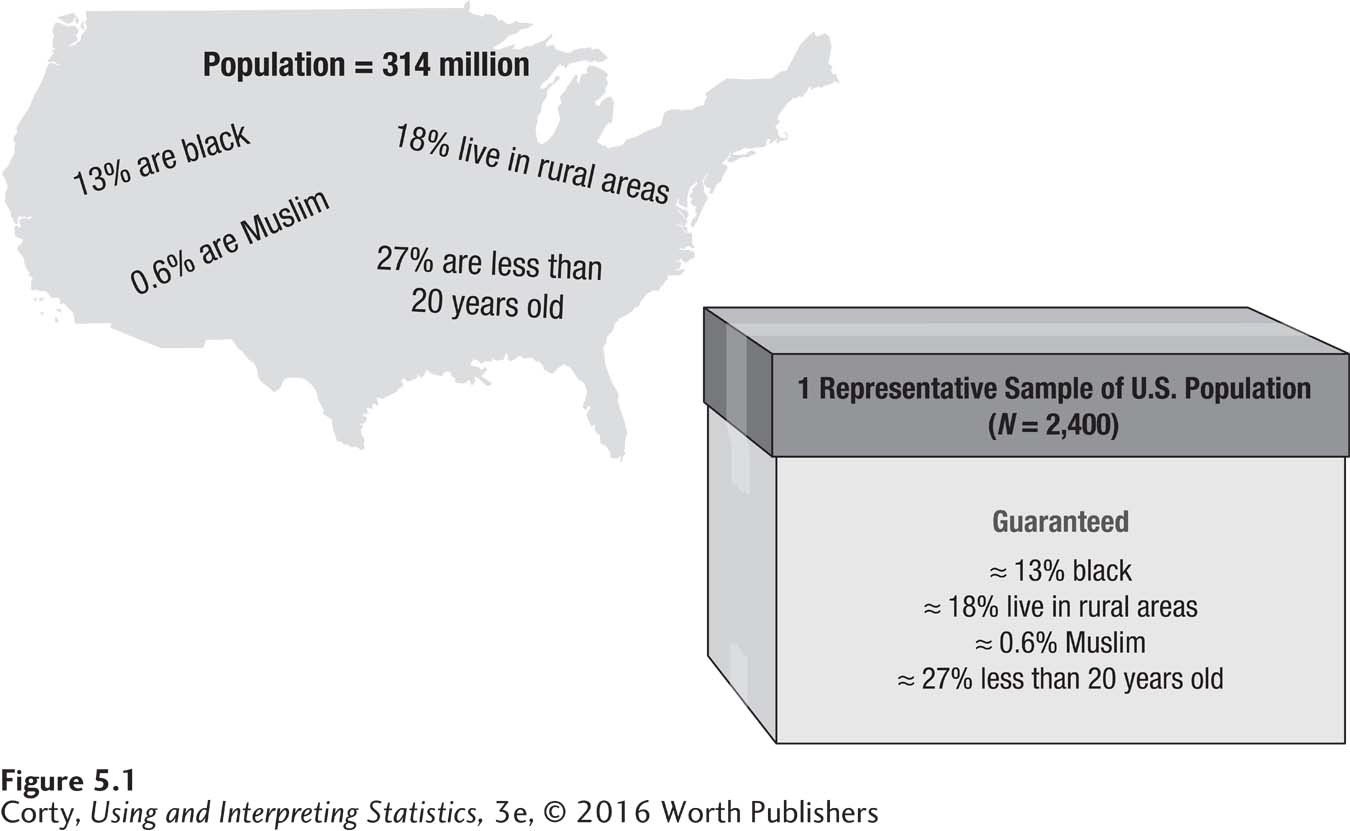
The way a sample is selected has an impact on whether the sample is a good one. What is meant by a “good” sample? A good sample is one that is representative of the population it came from. Representative means that all the attributes in the population are in the sample in the same proportions by which they are present in the population. Imagine obtaining a sample of students from a college and no one in the sample was a psychology major. That wouldn’t be a representative sample. If 3% of students at the college are psychology majors, then, for the sample to be representative, ≈3% of the sample should be psychology majors. For a representative sample, this would have to be true for all the other attributes of the students at the college—for race, religion, having an eating disorder, being an athlete, sexual orientation, wearing glasses, having divorced parents, and so on. A representative sample is like a microcosm of the population (see Figure 5.1).
When a sample is representative, the results of the study can be generalized from the sample back to the population. This is very handy. If a physician wants to know how much cholesterol is circulating in a patient’s bloodstream, she doesn’t have to drain all 10 pints of the patient’s blood. Instead, she takes a small test tube full of blood, measures the amount of cholesterol in that, and generalizes the results to the entire blood supply. This can be done because the blood in the test tube is a representative sample of the population of blood in the body.
Let’s move from medicine to psychology. How are samples obtained for psychology studies? Many use college students as participants. So, let’s make up a study in which a psychologist is studying students’ sexual attitudes and behaviors.
The psychologist goes to the student union at lunchtime, and as students pass through, he asks them to complete his survey. This is called a convenience sample, because it consists of easily gathered cases. Convenience samples are easy to obtain, but they are unlikely to be representative. Students who aren’t on campus that day, or who have classes at lunchtime, or who don’t walk through the student union can’t be in the sample. So, this sampling plan would not provide a representative sample of the student population.
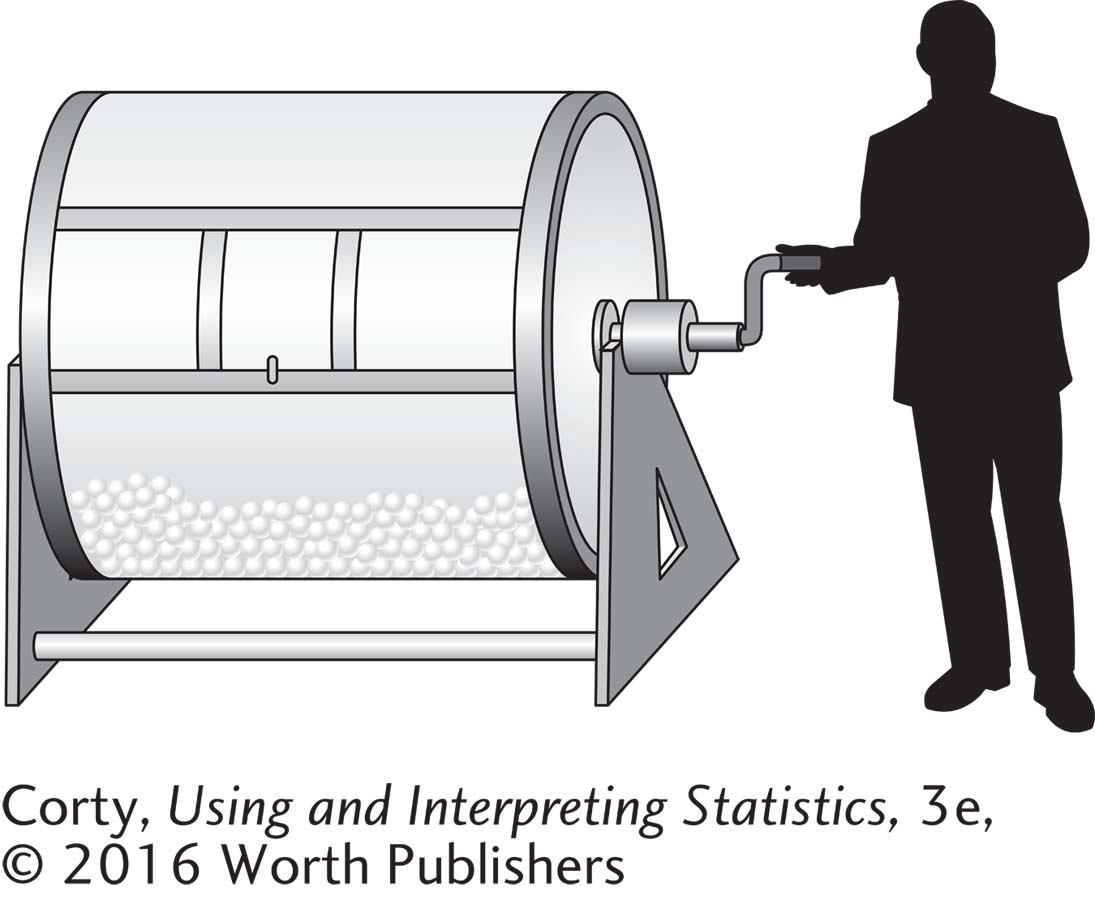
A solution is something called random sampling. In a simple random sample, all the cases in the population have an equal chance of being selected. To assemble a random sample, the psychologist might go to the registrar, get a list of the names of all registered students, put each name on a slip of paper, place all the slips in a barrel, mix it up, draw a name, mix the barrel again, draw another name, and so on. This way all students, whether they are on campus that day or not, whether they walk through the student union or not, have a chance of being in the researcher’s sample.
Of course, it is rare that researchers draw names out of a hat. Typically, researchers use a computer or a random number table to select a random sample. A random number table is a list of digits in random order, where the number 1 is just as likely to be followed by a 2 as it is by a 1 or a 9 or any other digit. Appendix Table 2 is a random number table and a section of it is reproduced in Table 5.1.
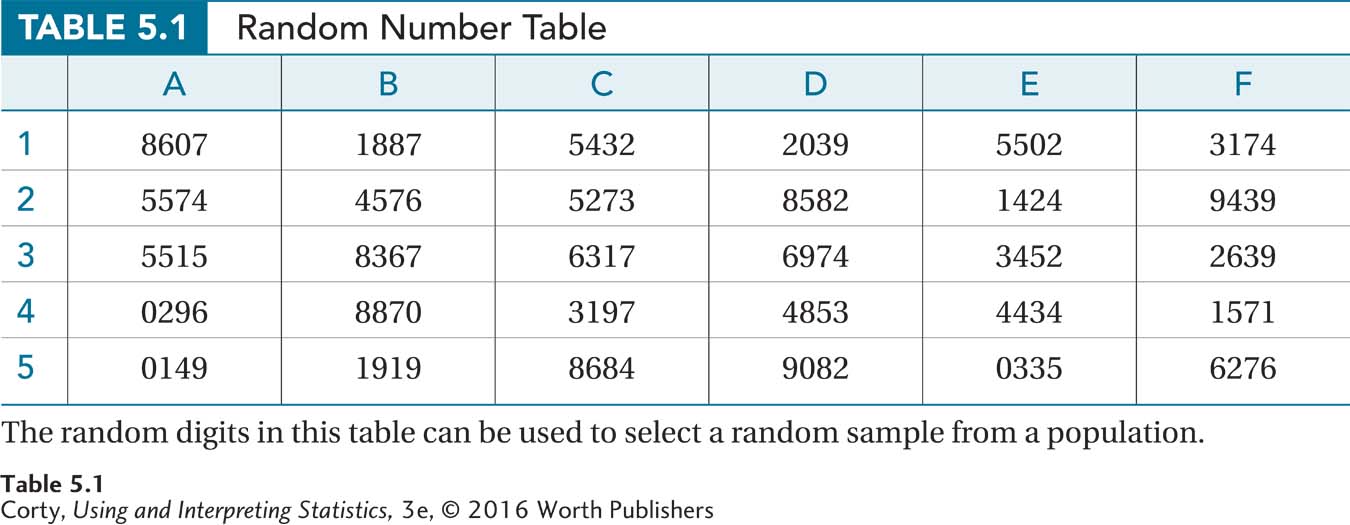
Suppose there are 4703 students at the psychologist’s college. Here’s how the random number table could be used to draw a random sample of 50 from the population of 4703. The first thing the researcher does is assign sequential numbers to the pool of participants. That is, he makes a list of all the students and numbers them from 1 to 4703. Next, he goes to the random number table and moves across it, looking for values of 4703 or lower. Each time such a value is encountered, that person will go in his sample. The first number in Table 5.1 is “8607.” There’s no case numbered 8607 in the sample, so he’ll skip this value. The next value, “1887,” is a hit, and the case numbered 1887 will become part of his sample. With the review of the first row complete, case numbers 2039 and 3174 are also part of the sample. The researcher will continue this process until he has randomly selected 50 cases numbered 4703 or lower.
A Common Question
Q What happens if the same number is selected again?
A If the same number occurs again and is included in the sample a second time, that is called sampling with replacement. Though in terms of the mathematics of probability, this is fair to do, no researcher ever does it when drawing a sample for a study. Sampling without replacement is almost always done.
Random selection is great, but it doesn’t guarantee a representative sample. Sample size, N, is also important. The law of large numbers states that other things being equal, larger samples are more likely to represent the population. Imagine that a researcher drew two random samples from a college, found the number of sexual partners for each person, and then wanted to use the mean number of sexual partners in the sample to represent the average number of sexual partners for students at the school. Which sample would provide a more accurate picture? One where N is 5, or one where N is 50? The larger sample, the one with 50 cases, is the better choice because it has a greater chance of capturing the characteristics of the population. A larger sample is more likely to provide a sample value close to the population value because it is more likely to contain the range of values that are in the population.
Problems with Sampling
With random samples, there are two problems to be concerned about. One is called self-selection bias, and the other is called sampling error. Self-selection bias occurs when not everyone who is asked to participate in a study agrees to do so. For example, in the study of students’ sexual attitudes and behavior, the researcher needs to describe the study to the randomly selected potential subjects and then let them decide if they wish to participate. That’s called informed consent. This study is about sex, a sensitive and private topic, so not everyone will wish to participate and the psychologist will end up with a self-selected sample. If the people who choose to participate differ in some way from those who choose not to participate (perhaps their attitudes and behaviors are more permissive), then the sample is no longer representative of the population. If too much self-selection occurs, the researcher can no longer generalize results from the sample to the population.
Problems with sampling and self-selection bias are why researchers need to pay careful attention to how samples are obtained and whether they are representative.
One can often tell when self-selection bias has occurred by looking at consent rate, the percentage of targeted subjects who agree to participate. If 100% of potential subjects agree to participate, then no problem with self-selection exists. If only 5% agree, then there is something unusual about those who agree and they shouldn’t be used to represent the population. But where does one draw the line between these two extreme situations? One rule of thumb is that self-selection bias isn’t a problem as long as the consent rate is above 70% (Babbie, 1973). Problems with sampling and self-selection bias are why researchers need to pay careful attention to how samples are obtained and whether they are representative.
Even when a sample is large, randomly obtained, and has a high consent rate, it is almost certainly not going to be an exact replica of the population. Let’s continue with the example of taking a random sample of college students and collecting information about sexual attitudes and behavior. Further, pretend that, somehow, each student at the college—the entire population of students—has reported how many sexual partners he or she has had. From this, it is possible to calculate a population mean (μ). The sample mean (M) should be close to that value, but it would be surprising if it were exactly the same. And, if the researcher took another random sample, it would be surprising if M2 were exactly the same as M1. These discrepancies between sample values and the population value are called sampling error.
Sampling error is the result of random factors, which means there is nothing systematic about it. Sampling error is thought of as normally distributed. This means that about half the time sampling error will result in a sample value, for example, a mean, that is larger than the population mean, and half the time sampling error will result in a sample mean smaller than the population mean. Because in a normal distribution most of the scores are bunched around the midpoint, more often than not, sampling error will be small. This means that usually the sample mean will be relatively close to the population mean. But, occasionally, sampling error will be large, resulting in a sample mean that is dramatically different from the population mean.
Worked Example 5.1
A familiar example, M&Ms, should help clarify sampling error. Every day millions of M&Ms are made in different colors. At the factory, the colors are mechanically mixed together and packaged for sale. Each package of M&Ms is like a random sample from the population of M&Ms manufactured that day.

Several years ago, I bought 500 of the single-serving bags of M&Ms, those that are sold at checkout counters. At the time, the Mars Company reported that 20% of the M&Ms it produced every day were red. This means that each bag, each random sample from the population of M&Ms, should contain 20% red M&Ms. However, due to sampling error, one would expect discrepancies between the population value, 20% red, and the percentage of red M&Ms found in the samples, the purchased bags. Figure 5.2 is a histogram showing the distribution of the percentage of red M&Ms for these 500 random samples. There are several things to note in this figure:
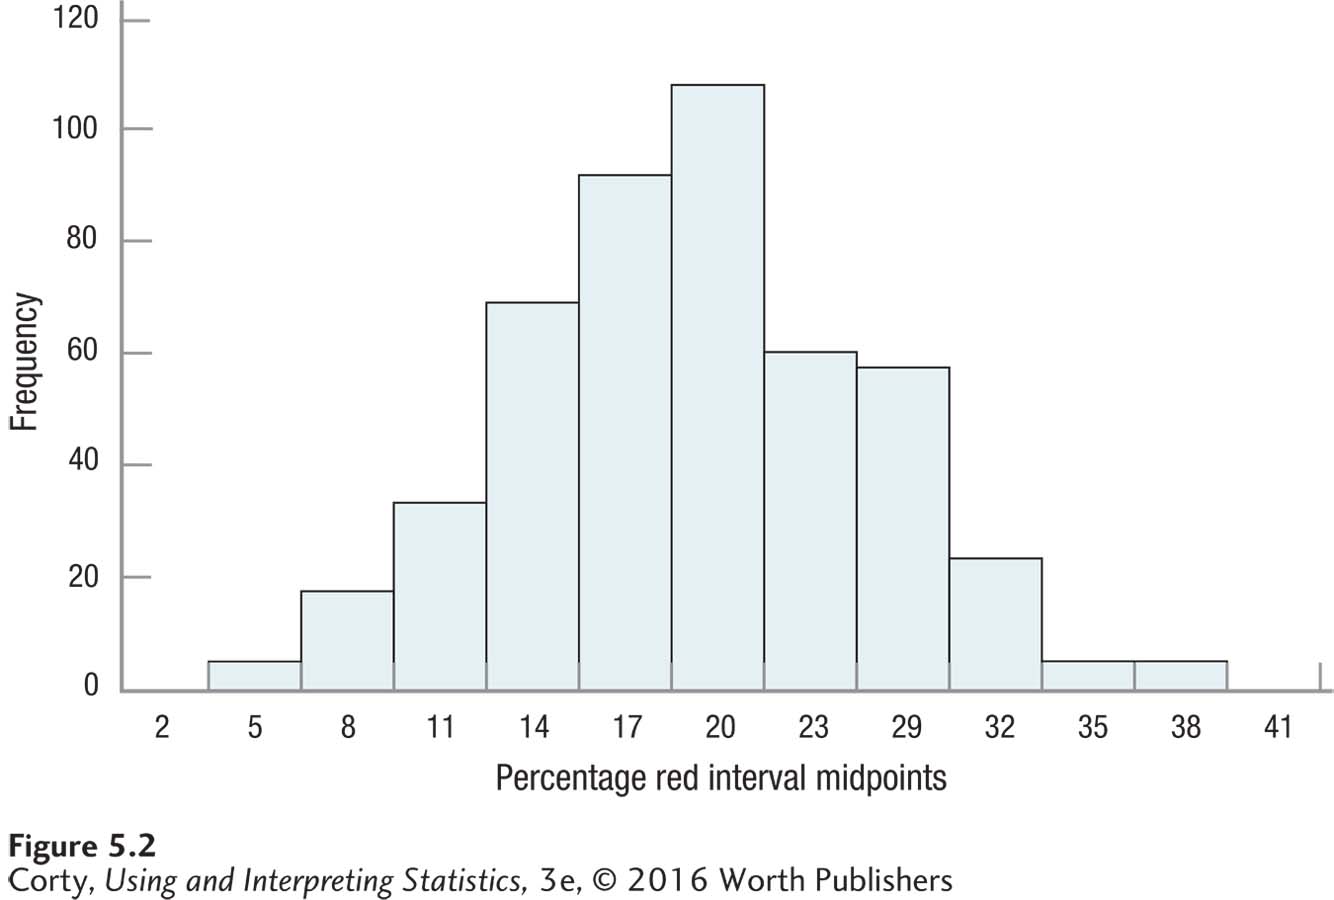
Though the most frequently occurring sample value is around 20% (the population value), the majority of samples don’t have 20% red M&Ms. That is, the majority of samples show evidence of sampling error.
A large percentage of the other values fall near the population value of 20%. So, sampling error is usually not large.
Occasionally, sampling error is large and leads to a sample value that is very different from the population value. Instead of being near 20%, there were bags of M&Ms that had only 5% red M&Ms and others that had up to 38% red M&Ms.
The distribution is symmetric. About half the cases have “positive” sampling error, resulting in a sample value that is greater than the population value, and about half have “negative” sampling error.
In fact, the distribution looks very much like a normal distribution, centered around the population value of 20% red.
Perhaps the most important thing to remember is that sampling error just happens by accident. There isn’t anything malicious going on. Random factors—for example, the way the M&Ms are mixed together—cause sampling error. It just happens. That’s why samples, even if they are random and large, are rarely exact replicas of populations.
When a researcher takes a single sample from a population and uses it to represent the population, he or she needs to bear in mind that sampling error is almost certainly present. The sampling error may be a positive amount or a negative amount. There probably is not too much sampling error, but it is also possible that—due just to random events and bad luck—there is a lot of sampling error. If the latter is the case, then the researcher shouldn’t generalize from the sample to the population. The trouble is, the researcher doesn’t know if there is a little or a lot of sampling error. If a Martian came to Earth, bought a bag of M&Ms, counted the colors, and found that 5% of the M&Ms were red, then it would probably conclude that red was an uncommon M&M color. And, as red actually makes up 20% of M&Ms, its conclusion would be wrong. But, the Martian wouldn’t know.
Practice Problems 5.1
Review Your Knowledge
5.01 What does it mean if a sample is representative of a population?
5.02 What is the consent rate for a sample?
5.03 What causes sampling error?
Apply Your Knowledge
5.04 There are 50 students in a class and they count off from 1 to 50. Describe how to draw a random sample of 10 students.
5.05 How can one minimize sampling error?