CHAPTER 27 APPENDIX The Magic of Compound Growth Using a Spreadsheet
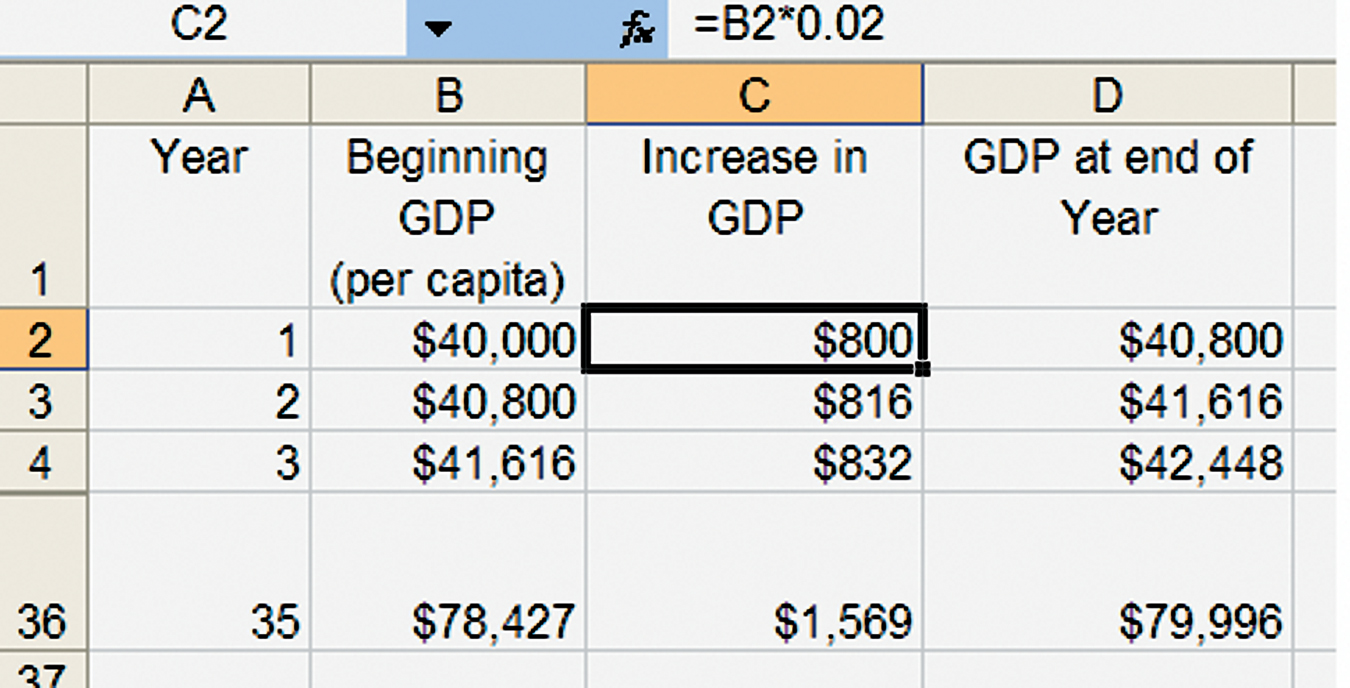
The rule of 70 gives us a quick way to compute doubling times given a growth rate. We can also use a Microsoft Excel spreadsheet to easily answer more difficult questions. We know, for example, that if GDP per capita starts at $40,000 and if the growth rate is 2%, then GDP per capita after 1 year will be $40,800 and after just 35 years it will double to $79,996. We can show this using a simple spreadsheet as in Figure A27.1.

Once we understand the principles, however, we don’t need to write each year on a separate line. Instead, we can simplify by using a little bit of mathematical notation.
If our Starting value for GDP per capita is $40,000 and the growth rate is r%, for example, 2%, and we grow for one year, then our Ending value will be $40,000 × (1 + r/100). If we grow for two years, our Ending value will be $40,000 × (1 + r/100) × (1 + r/100), which is the same thing as $40,000 ×  . More generally, if the growth rate is r % and we grow for n years, then

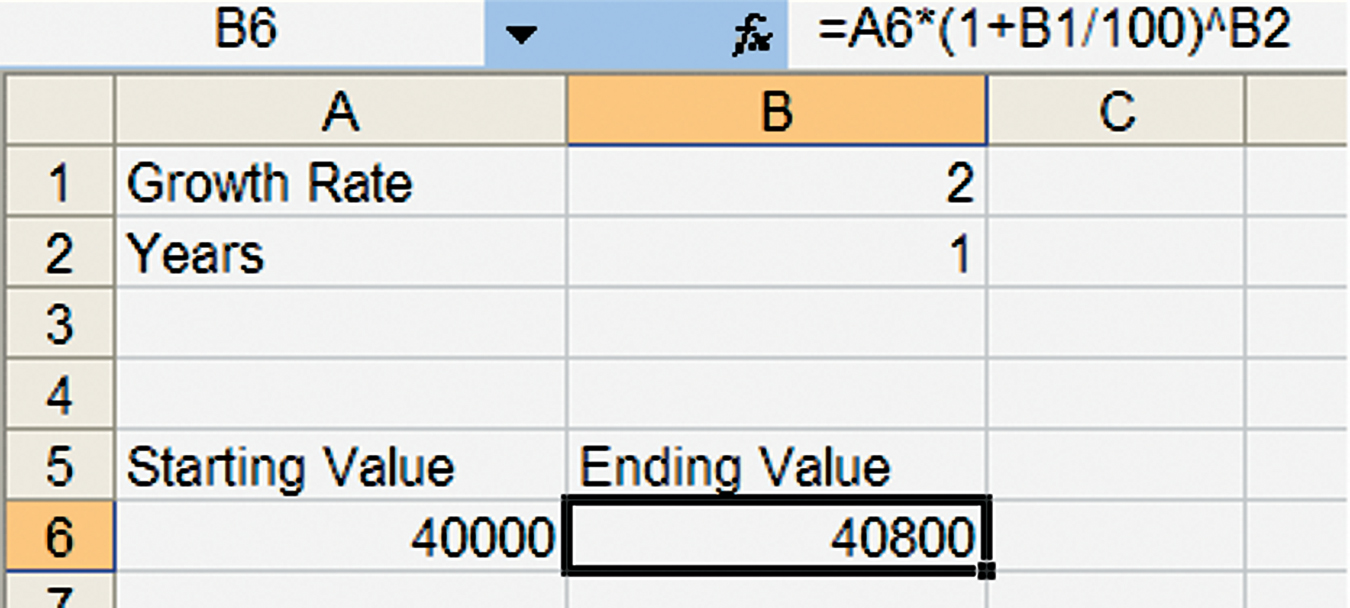
We can use this formula to simplify our spreadsheet, as in Figure A27.2.

140
Notice that we put the starting level of GDP per capita, or whatever quantity we are interested in (this could also be the amount of money in a bank account, for example), in cell A6, the growth rate is in cell B1, the number of years we want to grow is in cell B2, and thus the formula in cell B6, “=A6×(1+B1/100)^B2”, is exactly as in equation A1.
By adjusting the Starting value, the Growth rate, and the Number of years, we can find out how much any amount will grow to given any interest rate over any number of years.
We can also use Excel’s Goal Seek ability to work backward to find, say, the number of years it will take to reach a certain level of GDP per capita when growth is r% per year. Suppose for example that GDP per capita is $46,000 and that growth is 2% per year. How long will it take to reach a GDP per capita of $1,000,000? Here’s how you can easily find numbers like this. Go to the Tools menu and click on Goal Seek (in Excel 2007, go to the Data menu and under the submenu What-If Analysis, click on Goal Seek). A box will pop up asking you for three inputs: Set cell _____, To value _____, By changing cell _____. In our case, we want to Set cell B6, the EndingValue; To value 1,000,000; By changing cell B2, the number of years. Figure A27.3 shows you what you should see and input. Notice that we also changed the Starting value to $46,000.

141
Clicking OK produces what you see in Figure A27.4.

Goal Seek has solved the problem! If we start at a value of GDP per capita of $46,000 and we grow at 2% a year, then in 155.49 years we will reach a value of GDP per capita of $1,000,000.
By using Goal Seek and varying the inputs, you can find the answer to all kinds of questions. Can you find, for example, how high the growth rate would have to be to reach a level of GDP per capita of $1,000,000 in, say, 50 years?