CHAPTER REVIEW
FACTS AND TOOLS
Question 28.14
1. Which countries are likely to grow faster: countries doing “cutting-edge” growth or those doing “catching-up” growth?
Question 28.15
2. When will people work harder to invent new ideas: when they can sell them to a market of 10,000 people or when they can sell them to a market of 1 billion? Does your answer tell us anything about whether it’s good or bad from the U.S. point of view for China and India to become rich countries?
Question 28.16
3. Many say that if people save too much, the economy will be hurt. They often refer to the fact that consumer spending is two-thirds of GDP to make this point. This is sometimes called the “paradox of thrift.”
In the Solow model, is there a paradox of thrift? In other words, is a high savings rate good or bad for a country’s long-run economic performance?
165
What about in the real world? According to the data in Figure 28.8, is there a paradox of thrift?
Question 28.17
4. Many people say that “the rich grow richer and the poor grow poorer.” Is this what Figure 28.9 says about the countries in that graph? Did the rich countries grow more quickly or more slowly than the poor countries?
Question 28.18
5. Compared with its fast growth today, is China’s economy likely to grow more quickly or more slowly in the future?
Question 28.19
6. What is more important for explaining the standard of living in the rich countries: capital or ideas?
Question 28.20
7. According to Thomas Jefferson, how are ideas like flames?
Question 28.21
8. What is a patent?
Question 28.22
9. When will people work harder to invent new ideas: when they can patent those ideas for 1 year or when they can patent them for 10 years?
Question 28.23
10. Which three countries on the list are good examples of “conditional convergence?”
China
Ireland
Argentina
North Korea
Greece
Question 28.24
11. Let’s keep track of a nation’s capital stock for five years. Mordor starts off with 1,000 machines, and every year, 5% of the machines depreciate or wear out. Fortunately, the people in this land produce 75 machines per year, every year. The key equation for keeping track of capital is quite simple:
Next year’s capital = This year’s capital + Investment – Depreciation
Fill in the table.
|
Year |
Capital |
Depreciation |
Investment |
|---|---|---|---|
|
1 |
1,000 |
0.05 × 1,000 |
75 |
|
2 |
1,025 |
|
75 |
|
3 |
|
|
75 |
|
4 |
|
|
75 |
|
5 |
|
|
75 |
THINKING AND PROBLEM SOLVING
Question 28.25
1. Consider the following three countries that produce GDP this way:
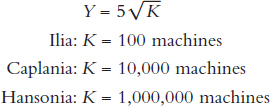
What will GDP (Y) be in these three countries? Hansonia has 10,000 times more machines than Ilia, so why isn’t it 10,000 times more productive?
Question 28.26
2. Consider the data in the previous question: If 10% of all machines become worthless every year (they depreciate, in other words), then how many machines will become worthless in these three countries this year? Are there any countries where the amount of depreciation is actually greater than GDP? (This question reminds you that “more machines mean more machines wearing out.”)
Question 28.27
3. Of course, no country makes only investment goods like machines, equipment, and computers. They also make consumer goods. Let’s consider a case where the countries in question 1 devote 25 % of GDP to making investment goods (so γ, gamma, = 0.25). What is the amount of savings in these three countries? In which countries is Investment < Depreciation? When is Investment > Depreciation?
Question 28.28
4. A drug company has $1 billion to spend on research and development. It has to decide on one of two projects:
Spend the money on a project to fight deadly forms of influenza including bird flu.
Spend the money on a project to fight a condition of red, itchy skin known as eczema.
The company expects both projects to be equally profitable, all things considered: Yes, project a is riskier (since the rare flu may never come along), but if the disease hits, there will be a worldwide market willing to pay a lot of money to cure the flu.
Then one day, before deciding between a and b, the drug company’s CEO reads in the newspaper that the European Union and the United States will not honor patents in the event of a major flu outbreak. Instead, these governments will “break the patent” and just make the drug available everywhere for $1 per pill. The company will only get $1 per pill instead of the $100 or $200 per pill it had expected.
166
Given this new information about the possibility that governments will “break the patent,” on which project is the company likely to spend its research and development money? (Note: In the wake of the deadly anthrax attacks of 2001, the U.S. government threatened to do just this with the patent for Cipro, the one antibiotic proven to cure the symptoms of anthrax infection.)
Question 28.29
5. After World War II, a lot of France’s capital stock was destroyed, but it had educated workers and a market-oriented economy. Do you think the war’s destruction increased or decreased the marginal product of capital?
Question 28.30
6. The Solow model isn’t useful for only thinking about entire countries: As long as the production function runs into diminishing returns and your total stock of inputs constantly wears out, then the Solow model applies. Consider a professor’s knowledge of economics. The more she learns about economics, the more she will forget (depreciation), but the more she knows, the more knowledge she can create (production). So eventually in steady state, she will know only a fixed amount about economics, but what she knows might change over time; some decades she might know a lot about the Federal Reserve, while other decades she might know a lot about the electricity market. In any case, knowledge fades away.
Apply the Solow model to a chef’s skill at cooking.
Apply the Solow model to the size of a navy’s fleet of ships.
Apply the Solow model to the speed of a cheetah, where the input is calories.
Question 28.31
7. Many inventors decide that patents are a bad way to protect their intellectual property. Instead, they keep their ideas a secret. Trade secrets are actually quite common: The formula for Coca-Cola is a trade secret, as is Colonel Sander’s secret recipe. What is one major strength of keeping a trade secret rather than applying for a patent? What is a major weakness inherent in going down the trade secret route?
Question 28.32
8. Since ideas can sometimes be copied quite easily, many people think that we should put more effort into creating new ideas. Let’s see if there are trade-offs to having more people creating new ideas. To keep things simple, let’s assume that the growth rate of the economy depends on how many people search for ideas, whether in laboratories, or huddled over laptops in coffee shops, or while listening to “Stairway to Heaven” at three in the morning. People either produce stuff or produce ideas. Here’s how this economy works:
Y1 = (1 – R) × A1L (GDP production function)
A1+1 = (1 + R) × A1L (Technology production function)
There are a total of L people in the society, and a fraction (1 – R) of them work in factories and offices making stuff (remember, people working in offices help create output, too!), while the remaining fraction R try to come up with good ideas all day long. To keep the story simple, there are no diminishing returns.
What’s the trade-off here? If 100% of the people work to make new ideas (R = 1), won’t that create a prosperous world?
In this society, if people are willing to wait a long time for a reward, should they choose a large R or a small R?
Plot out GDP in this society for 5 years if A starts off at 100, L starts off at 100, and R is 10%.
Year
A
Y
Y/L
1
100
9,000
90
2
110
3
4
5
Plot out GDP in this society if the society instead chose R = 20%.
Question 28.33
9. In Facts and Tools question 2, we saw that big markets create a big demand for inventions. This is an example of what Adam Smith meant when he said that “the division of labor is limited by the extent of the market.” Now let’s look at how big markets impact the supply side of inventions. The big idea is quite simple: More people means more ideas.
167
In order to create new ideas, you need to have people trying to come up with new ideas. In 1800, there were approximately 300 million humans on the planet—roughly equal to today’s U.S. population. If good ideas are “one in a million”—that is, if one person per year out of a million comes up with a world-shaking idea like contact lenses or James Brown’s song “The Payback” or the video game Grand Theft Auto—how many great new ideas will occur in the world of 1800? How many will occur in a world of 6 billion people?
More realistically, people in the rich countries are most likely to invent earth-shaking ideas and share them with others. There’s nothing special about people in rich countries, but they have the education and the laboratories and the Internet connections that will make it practical to invent and spread ideas. If only the top 20% of the earth’s population is really in the running to create new ideas, how many new big ideas will come along each year in 1800 and today?
If half of the population of India and China become rich enough to create new ideas (to simplify, assume populations of 1 billion each), and start coming up with big ideas at the same rate as the top 20%, how many big ideas will India and China alone create for the planet every year?
Many people think there are too many people on the planet. (As P. J. O’Rourke once wrote, many people’s attitude toward global population is “Just enough of me, way too much of you.”) Look at your answer from part b. If the world’s population now gets cut in half from the current 6 billion, how many big ideas will come along each year?
Question 28.34
10. According to economists Robert Barro and Xavier Sala-i-Martin, convergence isn’t just for entire nations: It’s also true for states and regions, as well. They looked at state-level GDP per capita in the United States in 1880, and then calculated how fast each state grew over the next 120 years. They found that convergence held almost exactly.
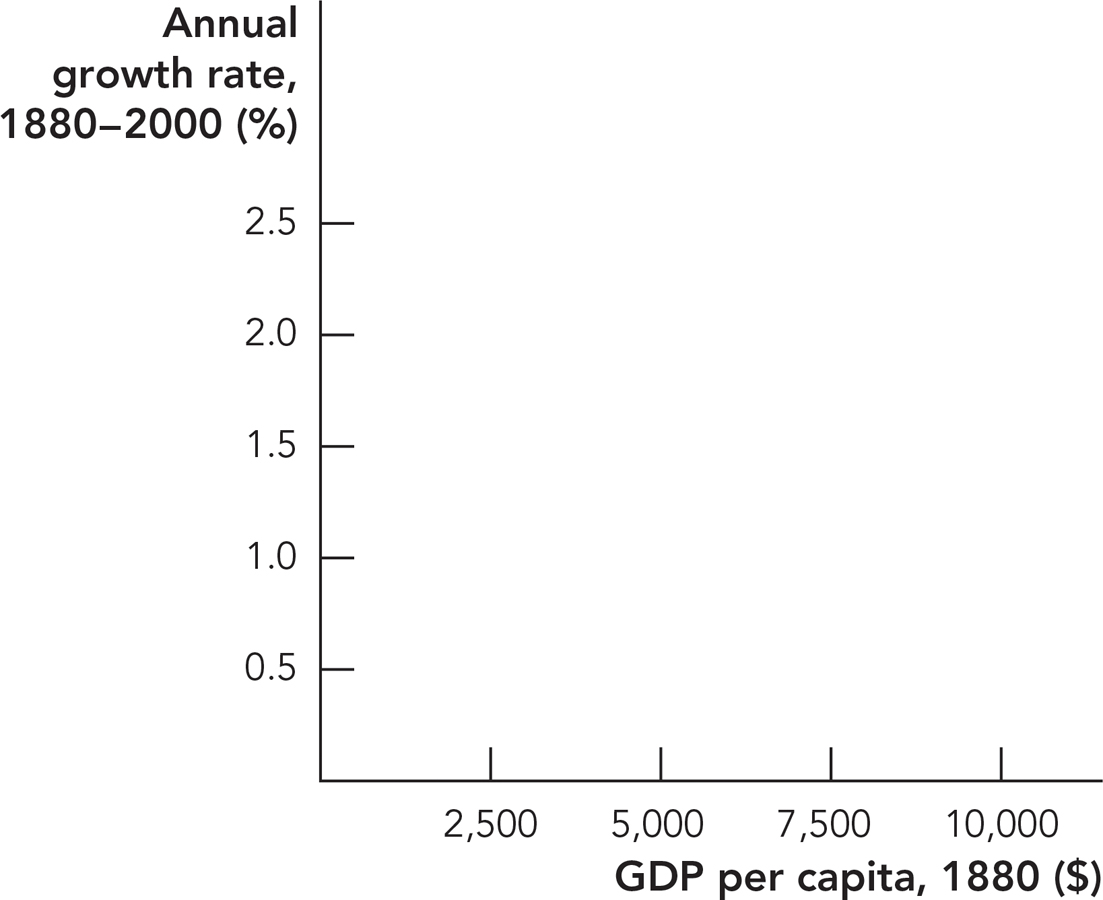
With this in mind, draw arrows to connect the GDP per capita data on the left with the long-term growth rates on the right.
GDP per Capita in 1880
Annual Growth Rate, 1880-2000
West: $8,500
1.6%
East: $6,300
1.7%
Midwest: $4,700
2.2%
South: $2,800
1.2%
Graph the data from part a in the following figure. Does this look like Figure 28.9’s story about the OECD countries, or is it quite different?
Note: Barro and Sala-i-Martin also found that convergence also held almost exactly for regions of Japan: The areas that were poorest in 1930 grew fastest over the next 70 years. Thus, it is difficult to find major evidence in favor of the commonsense idea that “the poor areas grow poorer.”
Question 28.35
11. Are we running out of ideas? Economist Paul Romer thinks not. To make things concrete, he notes that if we keep trying out different molecules to search for interesting compounds like new drugs, new plastics, etc., the universe may end from heat death before we finish our search. For example, if we try out 100 different atoms out of the 117+ (and rising!) elements in the Periodic Table, and only look at the 6-atom molecules, this is 1006 different molecules. And, of course, many common molecules in our bodies consist of hundreds of atoms, so this only scratches the surface of interesting compounds.
168
If it takes a machine 1 minute to test out and fully analyze a new 6-atom molecule, how many years will it take for this one machine to test out all 1006 molecules? (Note: Modern biochemists create computer simulations of molecules to analyze whether potential drugs are likely to work in the molecules that make up the human body, but this is only one narrow form of analysis.)
How many machines would it take to test out all of these molecules within 100 years?
What about all 10-atom molecules: How many years would it take for one machine to test all of these compounds at one per minute? If your computer can handle it, what about all 100-atom molecules, molecules vastly simpler than many proteins in your body?
CHALLENGES
Question 28.36
1. Which country would you expect to have a higher rate of investment: a catching-up country or a cutting-edge country?
Question 28.37
2. If the government of a poor catching-up country is trying to decide whether to encourage investment or encourage research and development, which of the two should it favor? (Note: In a world of trade-offs, you can’t just say, “Both are important!”)
Question 28.38
3. The Solow model makes it quite easy to figure out how rich a country will be in its steady state. We already know that you’re in a steady state when investment equals depreciation. In math, that’s
γY = δK
Since  in our simplest model, this means that K = Y2:
γY = δY2
There are a lot of ways to solve this for Y– the easiest might just be to divide both sides by Y, and then put everything else on the other side. When you do this, you can learn how steady-state GDP depends on the savings rate and the depreciation rate. Here are a few questions:
Many say that if people save more, that’s bad for the economy: They say that spending money on consumer goods keeps the money moving through the economy. Does this model say that?
Many people say that when machines and equipment get destroyed by bad weather or war, that makes the economy better off by encouraging businesses and families to spend money on new capital goods. Does this model say that?
Question 28.39
4. Let’s think about two countries, Frugal and Smart. In Frugal, people devote 50% of GDP to making new investment goods, so γ = 0.5, and their production function is  . In Smart, people devote 25% of GDP to making new investment goods, so γ = 0.25 and their production function is
  . Both countries start off with K = 100.
What is the amount of investment in each country this year?
What is the amount of consumption (GDP – Investment, or Y – I) in each country this year?
Where would you rather be a citizen: Frugal or Smart?
Question 28.40
5. Which of the following goods are non-rivalrous?
Sunshine
An apple
A national park
A Mozart symphony
The idea of penicillin
A dose of penicillin
Question 28.41
6. According to economist Michael Kremer, as human populations have grown over the last million years, so has the human population growth rate. This was true until the 1800s. How does Thinking and Problem Solving question 10 help explain why human populations grew more quickly despite the fact that there were more mouths to feed?
Question 28.42
7. Use the Solow diagram to show the impact of a natural disaster that destroys half of a nation’s capital stock.
Begin with a country in a steady state at
 , and show the short-run effects of the natural disaster destroying half of the steady-state level of capital stock, Kss on the Solow diagram.
169
If
 , will output fall by half so that output in period one following the shock is
  ? Explain why or why not.
What happens in this country in the immediate future and in the long run?
Question 28.43
8. A small less developed country finds itself the recipient of a large amount of foreign direct investment that adds 50% to its current steady-state level of capital stock. This country seeks your advice about the long-term implications of that kind of help.
Assume this country begins in a steady-state condition at
 , and show the short-run effects of a 50% increase in the steady-state level of capital stock such that
  on the Solow diagram.
What will the long-term effects of this increase in the capital stock be for this country?
What potential problems should this country consider during the adjustment period described in part b?
What must this country do in order to gain any permanent long-term benefits from this increase in its capital stock?
Bonus: Can you think of any examples like these in real life?
Question 28.44
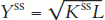
9. Change the production function used in the chapter to reflect the contribution of labor in the production process. As with capital, labor also has diminishing returns, so let  Now suppose that immigration reform leads to an increase in this country’s labor force.
Begin with a country in a steady-state condition at
 , and let Kss equal 400 and L = 100. What is the steady-state level of output?
Show the short-run effects of a 21% increase in the amount of labor available for use in this country such that L1 = 1.21 L on the Solow diagram.
What are the algebraic and numeric outcomes for the short-run level of output, that is, Yss in terms of Kss and L?
Show the new steady-state level of output on the diagram.
Demonstrate whether this country will be able to produce 21% more output with a 21% increase in the labor supply. Show this result algebraically. As illustrated in Challenge question 3, you will need to use the steady-state condition γY = δK to show this result.
Derive output per worker in the initial steady state (use
 from part a and divide by the labor force); output per worker in the short run (use
  from part c and divide by the new labor force); and output per worker in the long run (use from part e and divide by the new labor force).
Are the citizens of this country made worse or better off in the long run by a new immigration policy such as this; that is, how does the new long-run level of output per worker compare with the initial level of output per worker?
Bonus: What is the value for the new steady-state level of capital stock in this country?
!launch! WORK IT OUT
In the Solow model, you’ve seen that as the total stock of capital equipment gets larger, the number of machines wearing out grows as well. Often, most investment ends up just replacing worn-out machines. This is actually true in the United States and other rich countries. According to the U.S. National Income and Product Accounts (the official U.S. GDP measures), about 12% of total GDP just goes toward replacing worn-out machines and computers and construction equipment.
In the Solow model, if the depreciation rate increases, what happens to the steady-state capital level and output level? Answer in words and by using a diagram such as Figure 28.4. (Bonus: If the depreciation rate increases from 0.02 to 0.03, what is the new steady-state level of capital and output?)
If the Solow model explains an important part of the real world, should countries hope for high depreciation rates or low depreciation rates? How does this square with the observation that when machines wear out, that “creates jobs” in the manufacturing industries?
170