Defining and Measuring Inflation
Inflation is an increase in the average level of prices. We measure the average level of prices with an index, the average price from a large and representative basket of goods and services. Thus, inflation is measured by changes in a price index and the inflation rate is the percentage change in a price index from one year to the next:
Inflation is an increase in the average level of prices.

The inflation rate is the percentage change in the average level of prices (as measured by a price index) over a period of time.

where P2 is the index value in year 2 and P1 is the index value in year 1. A 10% inflation rate means, quite simply, that goods and services are priced (on average) 10% higher than they were a year ago.
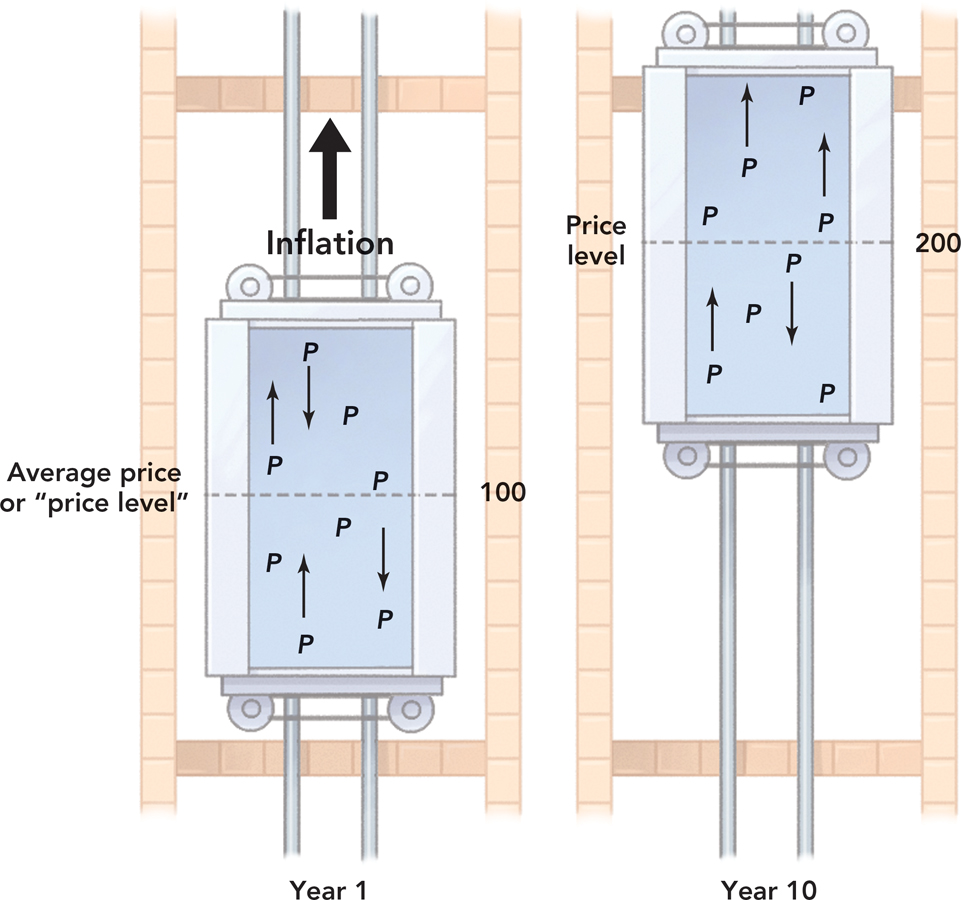
Shifts in supply and demand push prices up and down all the time, but inflation is an increase in the average level of prices. We can think of inflation as an elevator lifting all prices over time. In Figure 31.1, some prices in year 1 are going up and some are going down, but overall the average level of prices is 100. Inflation tends to lift all prices, so by year 10 the average level of prices is 200.
FIGURE 31.1

Price Indexes
Economists measure inflation using several different price indexes that are based on different bundles of goods:
Consumer price index (CPI): Measures the average price for a basket of goods and services bought by a typical American consumer. The index covers some 80,000 goods and is weighted so that an increase in the price of a major item such as housing counts for more than an increase in the price of a minor item like kitty litter.
Page 251GDP deflator: The ratio of nominal to real GDP multiplied by 100 (discussed in Chapter 26). The GDP deflator covers all final goods.
Producer price indexes (PPI): Measure the average price received by producers. Unlike the CPI and GDP deflator, producer price indexes measure prices of intermediate as well as final goods. PPI exist for different industries and are often used to calculate changes in the cost of inputs.
For most Americans, the CPI is the measure of inflation that corresponds most directly to their daily economic activity; for businesses and government, the other indexes take on greater relevance. We focus on the CPI unless otherwise indicated.
One point to remember about the CPI is that the basket of goods and services bought by the average consumer is changing all the time. The CPI, for example, contains a category for audio media like music. In 1975 music typically came on a vinyl record, but if the Bureau of Labor Statistics (BLS) measured the price of music by the price of vinyl records today, it would report that there has been a tremendous increase in the price because vinyl records are now expensive collector’s items. To avoid this problem, the BLS periodically updates the basket to reflect the introduction of new goods such as compact discs and MP3s. Changes in quality present a similar challenge. In 2007, when it was introduced, an iPhone cost $499, which is only a little bit more expensive than today, but the first iPhone had a 320 × 480-pixel resolution screen, a 2-megapixel camera, and 4 gigabytes of storage. Today’s iPhone has a 640 × 1,136-pixel resolution screen, an 8-megapixel camera that also takes HD movies, and 64 gigabytes of storage, among many other improvements. Thus, the true price of an iPhone—the price accounting for quality—is much lower today than in 2007. The BLS, which computes the CPI, tries to take both of these factors—new goods and better-quality goods—into account when computing the CPI, but it’s challenging. As a result of these challenges, some economists suggest that the CPI may actually overstate inflation by a little bit every year (0.9% is one estimate). That may not seem like much, but it can matter when making comparisons over several decades or more.
Inflation in the United States and around the World
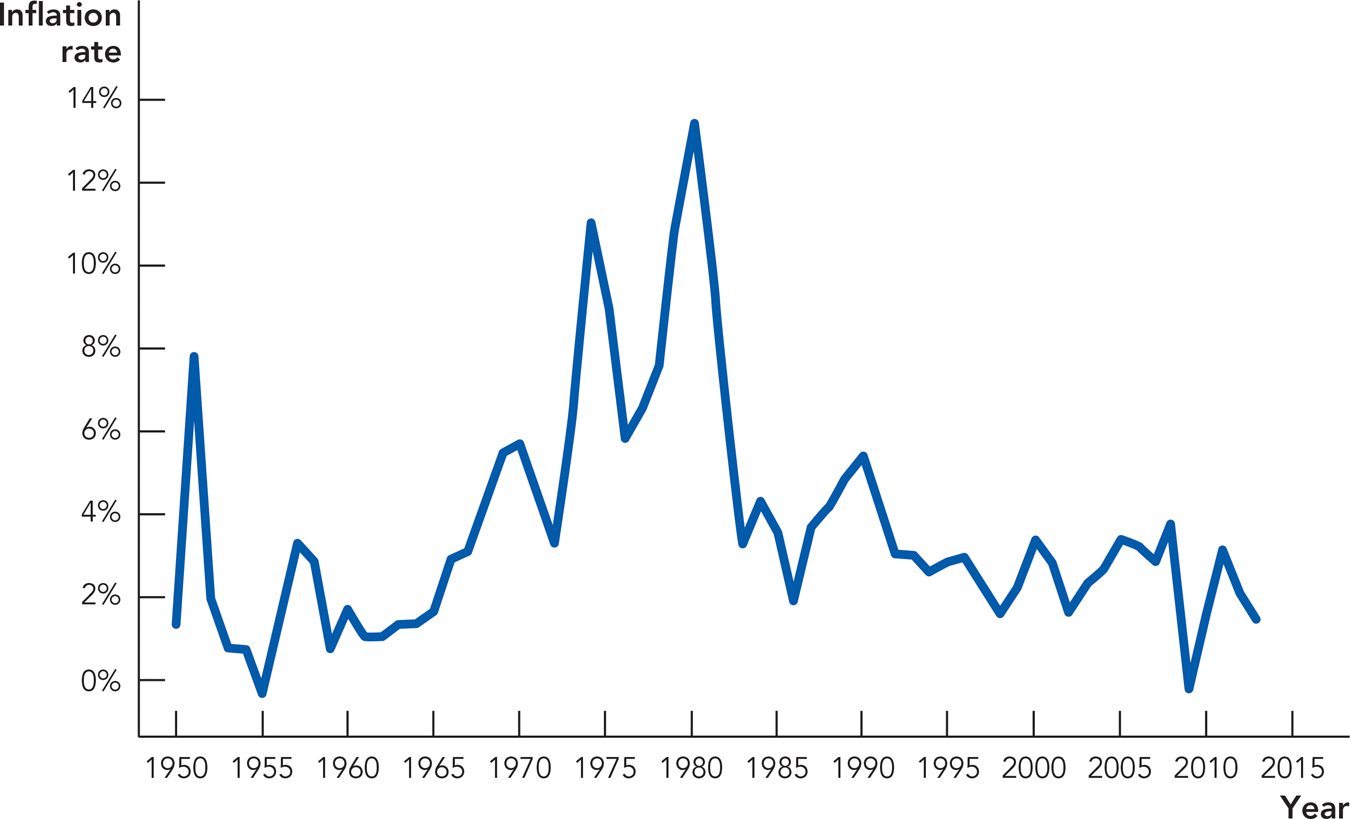
Figure 31.2 below shows the annual inflation rate in the United States since 1950. The average inflation rate over this period was 3.3%, but in many periods, especially in the 1970s, inflation was significantly higher. Over the past 10 years (2003–2013), inflation in the United States has averaged about 2.4%.
FIGURE 31.2

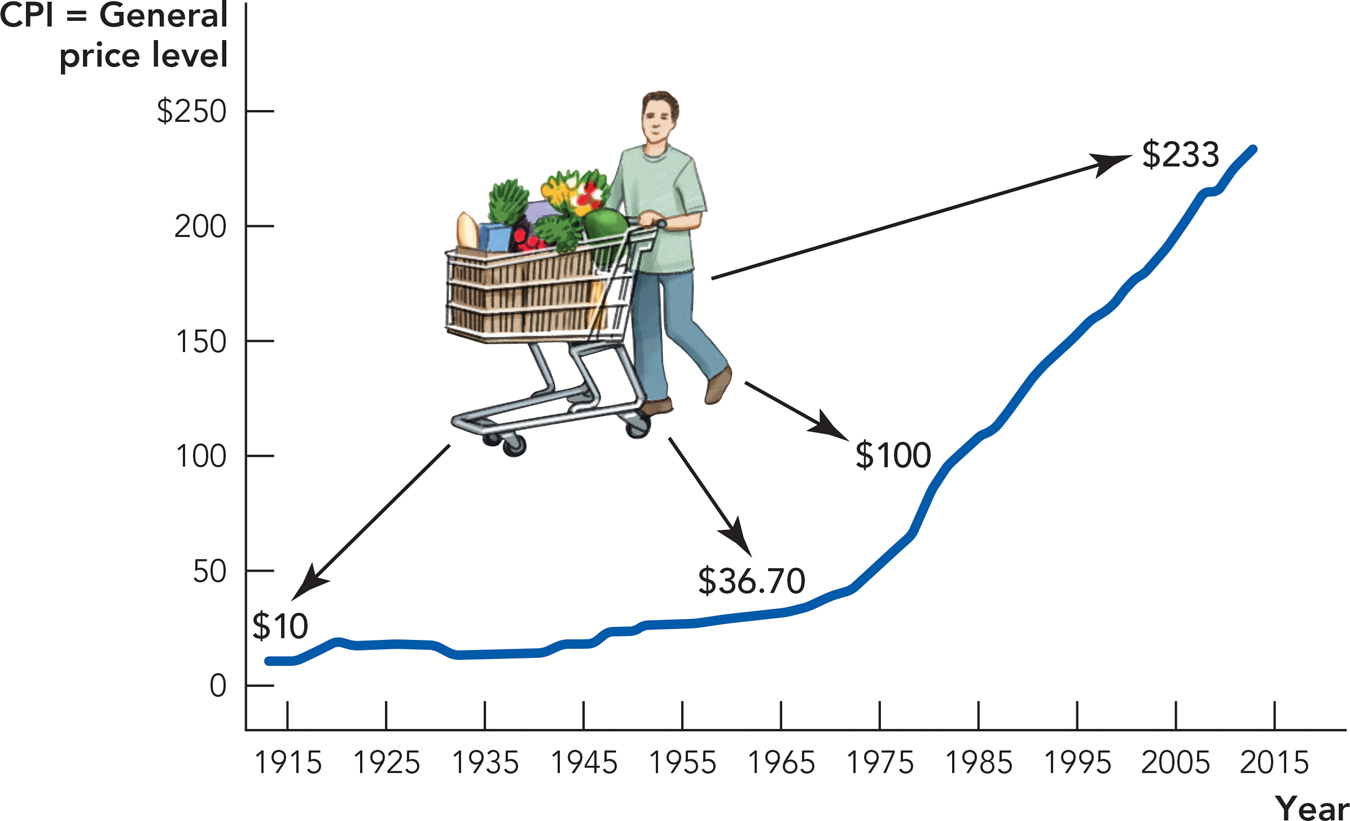
Figure 31.3 below illustrates the cumulative effect of inflation on a large basket of goods. A basket that cost about $10 in 1913 would have cost $36.70 in 1969, $100 in 1982, $207 in 2007, and $233 in 2013. The height of the line represents the level of the CPI during each year.
FIGURE 31.3

A real price is a price that has been corrected for inflation. Real prices are used to compare the prices of goods over time.
The CPI is often used to calculate “real prices.” A real price is a price that has been corrected for inflation. Real prices are used to compare the prices of goods over time. Suppose, for example, that you are told that the average price of a gallon of gasoline was $1.25 in 1982 but double that, $2.50, in 2006. These prices are correct, but should we conclude that gasoline was twice as expensive in 2006 than in 1982? No. The CPI was 100 in 1982 and 202 in 2006 so the price of most products doubled during this time period; wages rose, as well. Thus, the price of gasoline did not increase over this time period relative to other goods, so the real price of gasoline was about the same in 1982 as 2006. In the appendix to this chapter, “Get Real!,” we show in more detail how you can use data on the Internet to compute real prices over time.
Most prices go up over time, but there are exceptions. Pocket calculators now cost a few dollars; in 1972, they cost $395. In 1927, two-way radio phone service, America to London, cost $75 for five minutes. Today, a five-minute phone call to England costs mere pennies with Skype. In some cases, technological progress is so rapid that for particular goods and services, it overcomes the general tendency of prices to rise.
Recent U.S. inflation experience is moderate compared with international inflation rates and the historical record. Table 31.1 displays selected international inflation rates over the five years from 2002 to 2007. Between 2002 and 2007, Zimbabwe had the highest inflation rate in the world at 735% a year. At that rate, prices were doubling about every five weeks, but Zimbabwe was just beginning its inflation and in 2008 prices started to increase faster and faster and faster, so that by the end of 2008, prices were increasing at a rate of 79,600,000,000% per month! On the other end of the spectrum, the countries with the lowest inflation rates had rates of less than 1%. Using the rule of 70, we can see that if Japan continues to have an average inflation rate of 0.03%, the price level in Japan will double in about 2,333 years. From five weeks to 2,333 years, that is quite a difference.
Table 31.1 Average Annual Inflation Rates in Selected Countries (2002–2007)
|
Country |
Inflation Rate (%) |
|---|---|
|
Zimbabwe |
735.6 |
|
Angola |
33.8 |
|
Guinea |
20.0 |
|
Myanmar |
19.9 |
|
Eritrea |
19.7 |
|
Russia |
11.0 |
|
United States |
3.0 |
|
China |
2.1 |
|
United Kingdom |
1.9 |
|
Brunei |
0.8 |
|
Saudi Arabia |
0.7 |
|
Hong Kong |
0.5 |
|
Kiribati |
0.4 |
|
Japan |
0.03 |
|
Source: International Monetary Fund, World Economic Outlook Database. |
|
In 2008, the inflation rate in Zimbabwe approached the world record for a hyperinflation but in 2009, just before breaking the record, the government legalized transactions in foreign currencies and the Zimbabwe dollar effectively ceased to exist. Table 31.2 below presents some figures for major “hyperinflations.” The numbers in Table 31.2 are so high, they are hard to believe, but they are true. In Germany, for example, what cost 1 reichsmark in 1919 cost half a trillion reichsmarks in 1923.
Table 31.2 Selected Episodes of Hyperinflation
|
Nation |
Period |
Cumulative Inflation Rate (%) |
Maximum Inflation Rate on a Monthly Basis (%) |
|---|---|---|---|
|
America |
1777–1780 |
2,702 |
1,342 |
|
Bolivia |
1984–1985 |
97,282 |
196 |
|
Peru |
1987–1992 |
17,991,287 |
1,031 |
|
Yugoslavia |
1993–1994 |
1.6 × 10⁹ |
5 × 10¹⁵ |
|
Nicaragua |
1986–1991 |
1.2 × 10¹⁰ |
261 |
|
Greece |
1941–1944 |
1.60 × 10¹¹ |
8.5 × 10⁹ |
|
Germany |
1919–1923 |
0.5 × 10¹² |
3,250,000 |
|
Zimbabwe |
2001–2008 |
8.53 × 10²³ |
7.96 × 10¹⁰ |
|
Hungary |
1945–1946 |
1.3 × 1024 |
4.19 × 10¹⁶ |
|
Source: Fisher, Stanley, Ratna Sahay, and Carlos A. Vegh. 2002. Modern hyper- and high inflations. Journal of Economic Literature, American Economic Association 40(3): 837–880. Anderson, Robert B., William A. Bomberger, and Gail E. Makinen. 1988. The demand for money, the “reform effect,” and the money supply process in hyperinflation: The evidence from Greece and Hungary reexamined.” Journal of Money, Credit and Banking 20: 653–672, http://en.wikipedia.org/wiki/Hyperinflation, http://www.sjsu.edu/faculty/watkins/hyper.htm, and http://www.cato.org/zimbabwe. |
|||
Hungary’s postwar hyperinflation is the largest on record. The numbers are so high, they are difficult to describe. What cost 1 Hungarian pengo in 1945 cost 1.3 septillion pengos at the end of 1946. Seeing numbers like this, the physicist Richard Feynman said that really big numbers should not be called “astronomical” but “economical.”
CHECK YOURSELF
Question 31.1
 If the CPI was 120 this time last year and is 125 right now, what is the inflation rate?
Question 31.2
 If the inflation rate goes from 1% to 4% to 7% over two years, what will happen to the prices of the great majority of goods: Will they go up, stay the same, go down, or do you not have enough information to say?
Question 31.3
 Why do we use real prices to compare the price of goods across time?