CHAPTER 31 APPENDIX Get Real! An Excellent Adventure
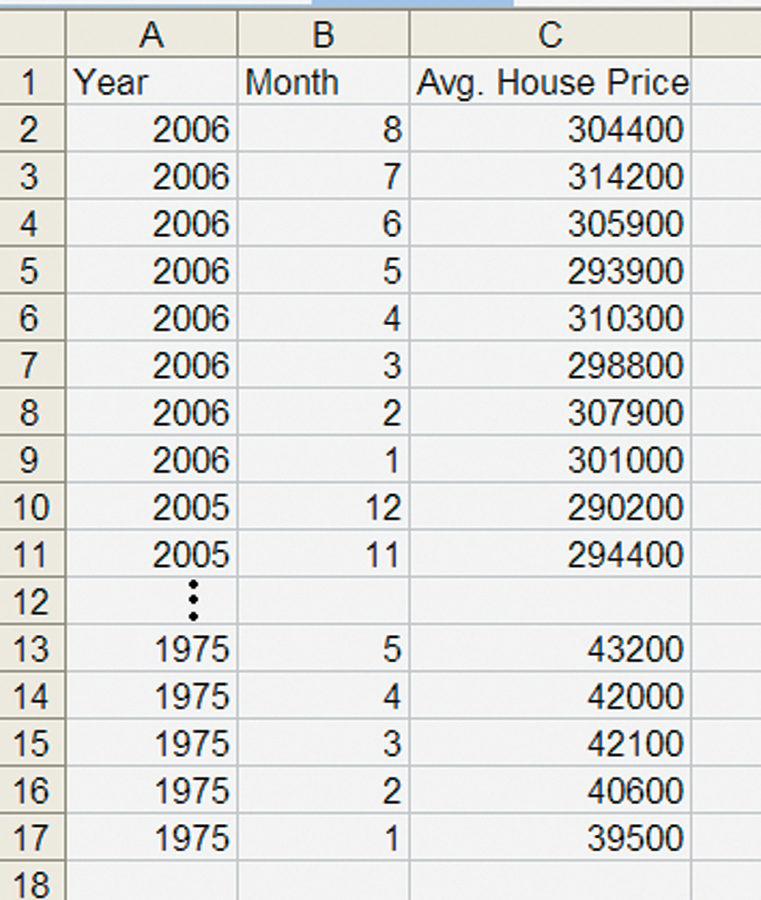
Suppose that you would like to convert a nominal data series into an inflation-corrected or real data series. How do you do it? Let’s suppose that you have already imported the nominal data that you want to convert into a spreadsheet. At the U.S. Census Bureau, for example, we found monthly data showing the average price of new houses sold from 1975 to 2006.* We then imported these into a spreadsheet, as shown in Figure A31.1. In 2006, the average house price was $304,400, but in 1975 it was only $39,500. Do you think the average new house was really more than seven times as expensive in 2006 as in 1975?

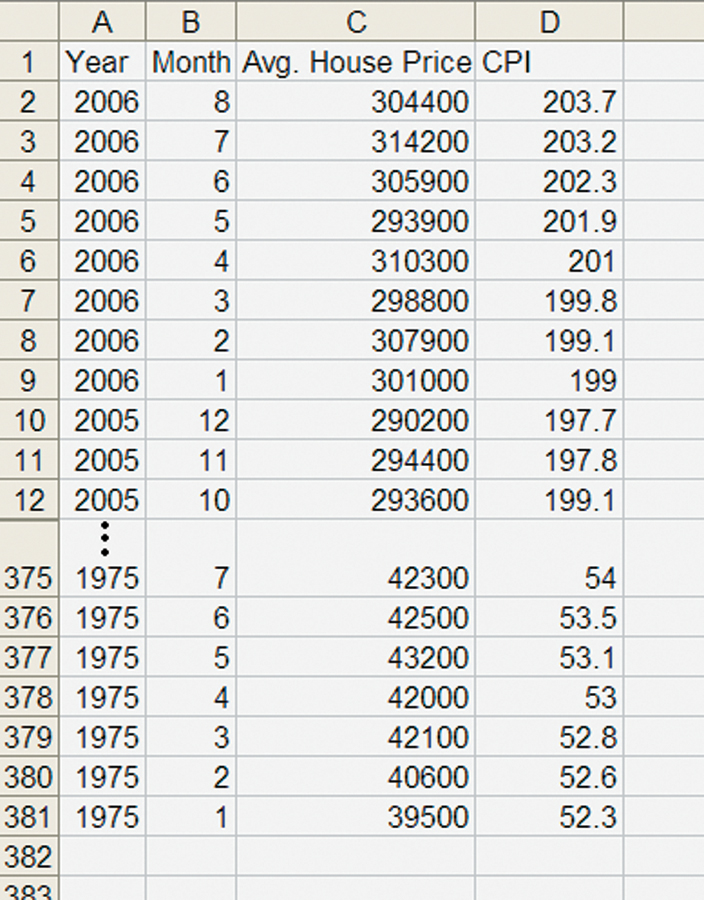
Inflation has increased all prices, including wages, since 1975 so some of the increase in house prices isn’t real. To correct for inflation, we need a price index, a measure of how much prices in general have changed. We found several monthly price indexes at the Bureau of Economic Analysis. The most commonly used index is the consumer price index or CPI.* Importing the CPI gives us a spreadsheet like Figure A31.2.

270
The CPI for August 2006 was 203.7 and for January 1975 it was 52.3. Prices in general were about 3.89 times higher (203.7/52.3 = 3.89) in 2006 than in 1975 so a substantial fraction of the increase in house prices wasn’t real. We can be more precise by calculating for any year how much a house would have cost in that year if general prices had been at the same level as they were in August 2006. Another way of saying this is that we will convert all prices into “August 2006 dollars.”
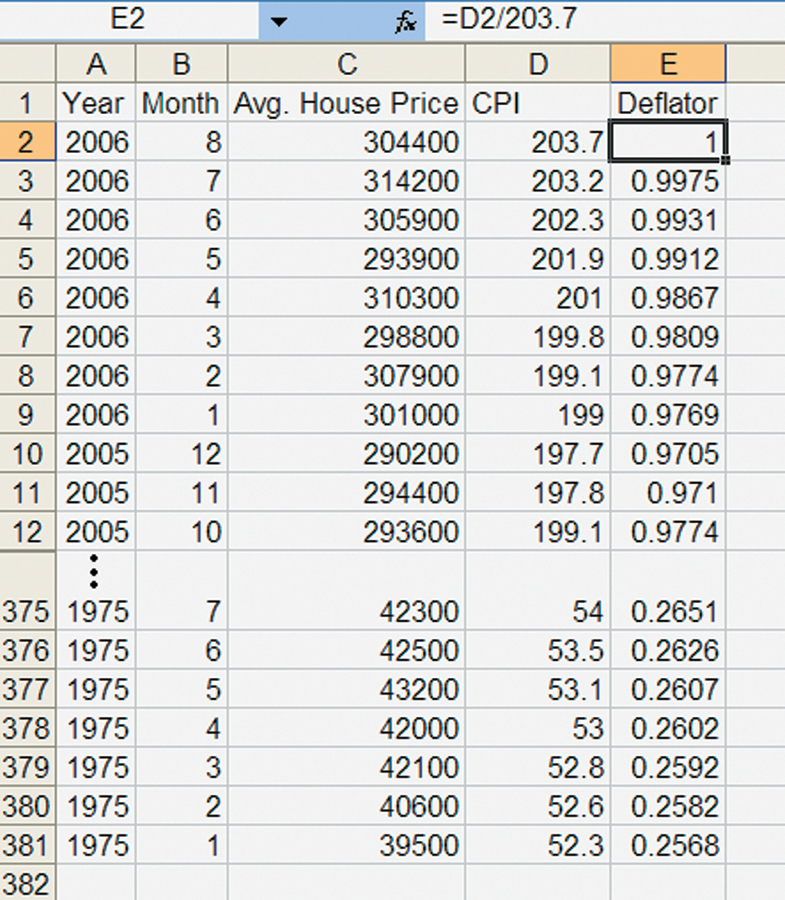
To convert into August 2006 dollars, we need two more steps. First, we divide every CPI number by the level of the CPI in the 8th month of 2006, 203.7. We call the new series the deflator. Figure A31.3 gives the picture—note that we copied the formula D2/203.7 into each cell in the Deflator column.

271
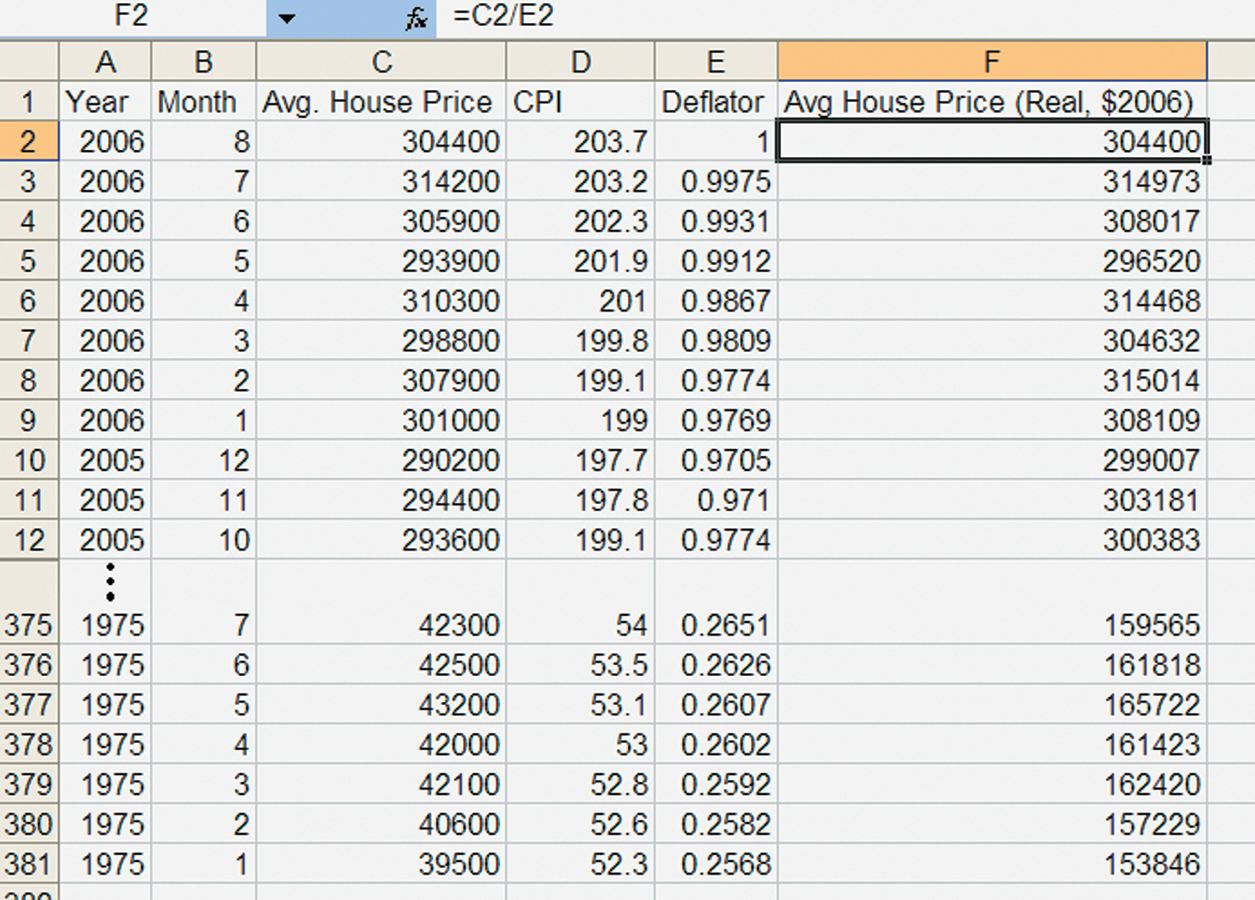
Finally, we divide the average house price by the deflator. Note that dividing the average price in August 2006, $304,400, by 1 doesn’t change the price—that makes sense because we are converting all prices into August 2006 dollars! Figure A31.4 below gives the final picture.

What we have now discovered is that if prices in general were as high in 1975 as they were in 2006, then house prices in 1975 would have been $153,846 instead of the 1975 dollar price of $39,500. Now that we have created a real-price series for housing, we can find the real increase in the price of housing. Holding prices constant at 2006 levels, house prices in 2006 were $304,400 and in 1975 they were $153,846, so over this time period houses have about doubled in price ($304,400/$153,846 = 1.98). A doubling is a substantial increase, but it’s a lot less than a seven times increase!
Can you think of a reason, other than inflation, why houses might be more expensive in 2006 than in 1975? Here’s one—the average new house in 1975 was quite a bit smaller than the average new house in 2006. In 1975, for example, 25% of houses were less than 1,200 square feet in size! In 2006, only 4% of new houses were less than 1,200 feet in size.* So if we wanted to get an even more accurate picture of the true increase in the price of housing, we should calculate the price per square foot of housing. If we were to do that, we would find that the average price of housing has less than doubled. All of this demonstrates that getting real can be quite tricky, but it’s worthwhile if we want to correctly understand how the economy has grown and changed over time.
272
* To derive this equation, we have used a convenient mathematical fact that if Y = A × B, then the growth rate of Y is approximately equal to the growth rate of A plus the growth rate of B.
* The Fisher effect equation in the text is only approximate. The exact Fisher effect equation is (l + i) = (l + r)(l + π). If a lender wants a real rate of return of 5% (r = 0.05) and the inflation rate is 10% (π = 0.1), then the lender must charge a nominal rate of 1.155 (1.10 × 1.05), or 15.5%. When inflation rates are low, the approximation works well but not during hyperinflations.
* http://www.census.gov/const/uspricemon.pdf
* Since housing makes up a large component of the CPI, we should technically use the CPI-Less Shelter, but in practice the two series are nearly identical.
* http://www.census.gov/const/uspricemon.pdf.