The Aggregate Demand Curve
The aggregate demand curve shows all the combinations of inflation and real growth that are consistent with a specified rate of spending growth  .
.
The aggregate demand curve tells us all the combinations of inflation and real growth that are consistent with a specified rate of spending growth. The easiest way to explain an AD curve is to derive it using the quantity theory of money from Chapter 31. Recall that we can write the quantity theory in dynamic form as

Key Equation
 Inflation + Real growth
where  is the growth rate of the money supply;
  is growth in velocity (how quickly money is turning over);
  is the growth rate of prices, that is, the inflation rate which we also write as π; and
  is the growth rate of real GDP, which we simplify and call real growth. Thus, we can also write equation 1 as

Now imagine that  = 5%,
= 5%,  = 0%, and real growth is 0%. What is the inflation rate? To answer that question, we substitute what we know into equation 2. Thus, 5% + 0% = Inflation + 0%, so Inflation = 5%. Intuitively, if the money supply is growing by 5% a year (
 = 5%) and velocity is stable (
 = 0%), then spending is growing by 5% a year. But if there are no additional goods to spend the money on, that is, if real growth is 0%, then prices must rise by 5%. In short, more spending plus the same goods equals higher prices.
An AD curve tells us all the combinations of inflation and real growth that are consistent with a specified rate of spending growth  . We have just discovered one such combination; an inflation rate of 5% and a real growth rate of 0% are consistent with a spending growth rate of 5%. But what other combinations of inflation and real growth are consistent with a spending growth rate of 5%?
Check the Math
If the money supply is growing at 5% per year ( = 5%) and velocity is stable (
 = 0%), then Inflation + Real growth must equal 5%. If Real growth is 3%, then Inflation must be 2%.
What would the inflation rate be if, just as before,  = 5% and
  = 0%, but now real growth = 3%? Once again, we substitute what we know into equation 2. Thus, we have 5% + 0% = Inflation + 3%, so Inflation = 2%. The intuition is quite simple. Inflation is caused when more money chases the same goods. So, if more money is chasing an increased quantity of goods, then, all else being equal, the inflation rate will be less than the increase in money growth.
276
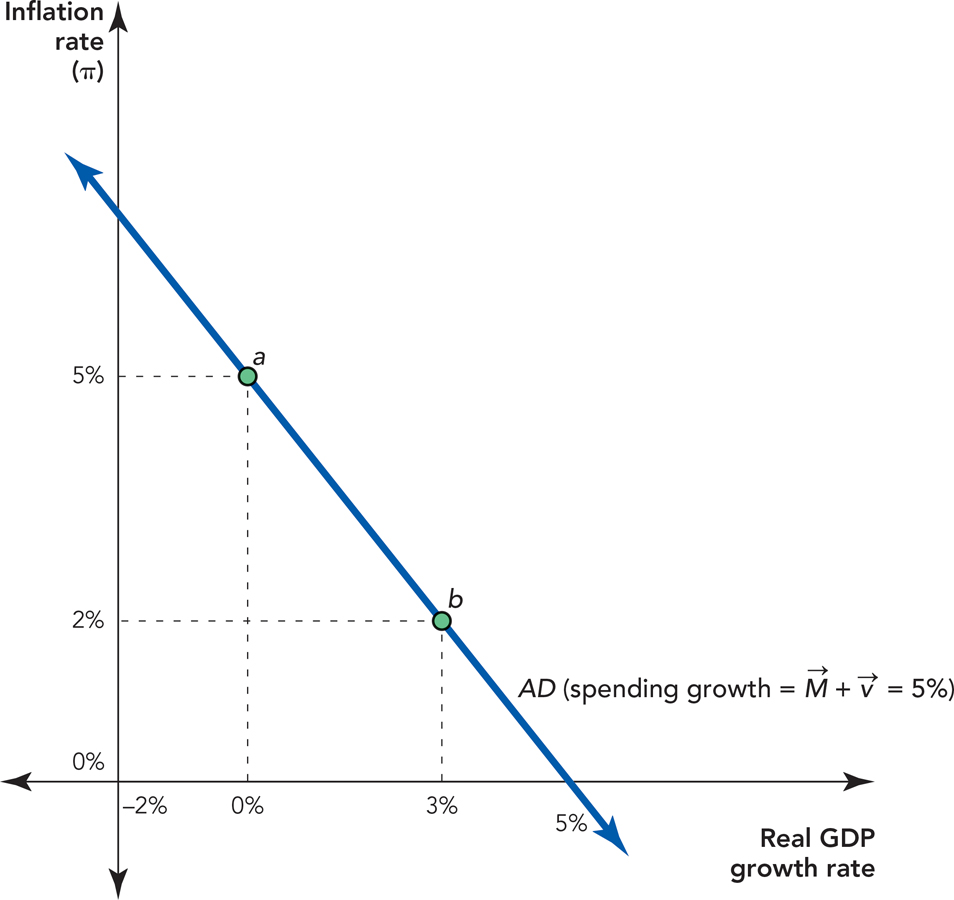
Thus, we now have two combinations of inflation and real growth that are consistent with a spending growth rate of 5%. In Figure 32.3, point a shows an inflation rate of 5% and a real growth rate of 0%, and point b shows an inflation rate of 2% and a real growth rate of 3%. Both of these combinations are consistent with a spending growth rate of 5%, so they belong on the same AD curve. In fact, from equation 2 we know that all the combinations of inflation and real growth that are consistent with a spending growth rate of 5% must satisfy the equation 5% = Inflation + Real growth. In other words, any combination of inflation and real growth that adds up to 5% is on the same AD curve. Figure 32.3 shows the AD curve for a spending growth rate of 5%. Thus, all the points on this line add up to 5%.

Notice also that the AD curve is a straight line with a slope of −1.*; This means that, given the rate of spending growth, a 1 percentage point increase in real growth reduces inflation by 1 percentage point.
277
Shifts in the Aggregate Demand Curve
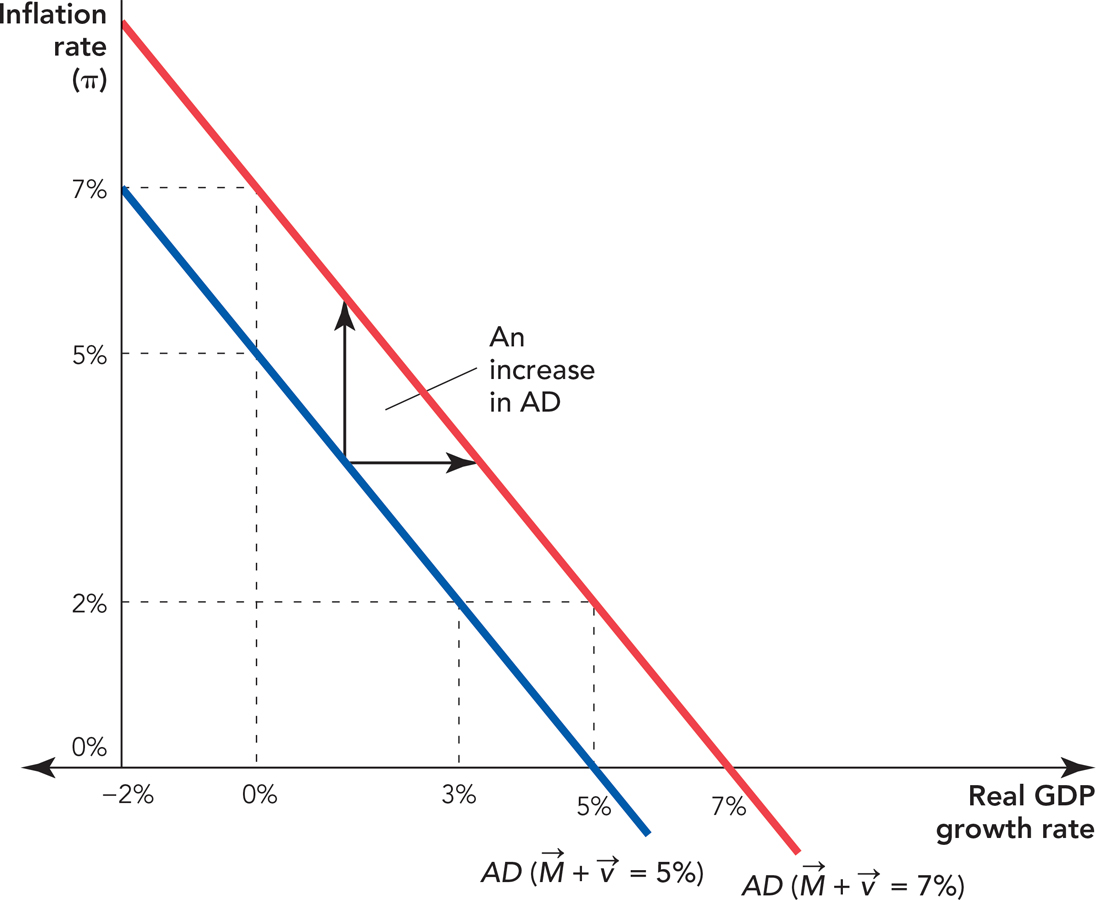
The AD curve for a spending growth rate of 5% is all the combinations of inflation and real growth that add up to 5%. So, what is the AD curve for a spending growth rate of 7%? Right, all the combinations of inflation and real growth that add up to 7%. So, now that we know what an AD curve is, we also know how the AD curve shifts. In Figure 32.4, for example, notice that all the combinations of inflation and real growth along the AD curve denoted AD ( = 5%) add up to 5% and all the combinations of inflation and real growth along the AD curve denoted AD (
 = 7%) add up to 7%. Thus, if spending growth increases to 7%, either because of an increase in
  or an increase in
  , then the AD curve shifts up and to the right (outward). The intuition is that increased spending must flow into either a higher inflation rate or a higher growth rate. Thus, an increase in spending growth shifts the AD curve outward, up and to the right, and, of course, a decrease in spending growth shifts the AD curve inward.

 , increases AD, shifting the curve up and to the right (outward). Note that each curve is defined by a specified level of spending growth. For example, along the curve AD (
 = 5%) each combination of inflation and real growth must add to 5%. Along the curve AD (
 = 7%) each combination of inflation and real growth must add to 7%.
As we have said, an increase in spending growth can be caused by either an increase in  or
or  . Later on in this chapter and in Chapter 35 and Chapter 37 on monetary and fiscal policy, respectively, we explain exactly what this means in practice. For now, we just need to remember that increased spending growth shifts the AD curve outward and decreased spending growth shifts the AD curve inward.
CHECK YOURSELF
Question 32.1
 If we have an aggregate demand curve with
  = 7% and
  = 0%, what will inflation plus real growth equal? If we find out that real growth is 0%, what is inflation?
Question 32.2
 Increased spending growth shifts the aggregate demand curve which way: inward or outward?
278