CHAPTER REVIEW
FACTS AND TOOLS
Question 33.2
1. Take a look at Figure 32.9. In the last few decades, what has usually happened to the price of oil just before or during a recession?
Question 33.3
2. When oil price shocks force people to switch jobs, how much GDP are they producing when they are out of work?
Question 33.4
3. Do you know anyone who “intertemporally substitutes” their labor? In other words, what are some careers where someone might choose to work more during times when the wage is higher but less when the wage is lower? (Example: someone with a lawn-mowing business.) Think of three examples of such careers. (Hint: Seasonal jobs provide a lot of easy examples.)
Question 33.5
4. When an investment is irreversible, are you likely to make that decision in a hurry or wait until more information comes in?
Question 33.6
5. When do you want to study for a test: when your friends are studying for the same test or when they are not? How can this help explain seasonal business fluctuations?
Question 33.7
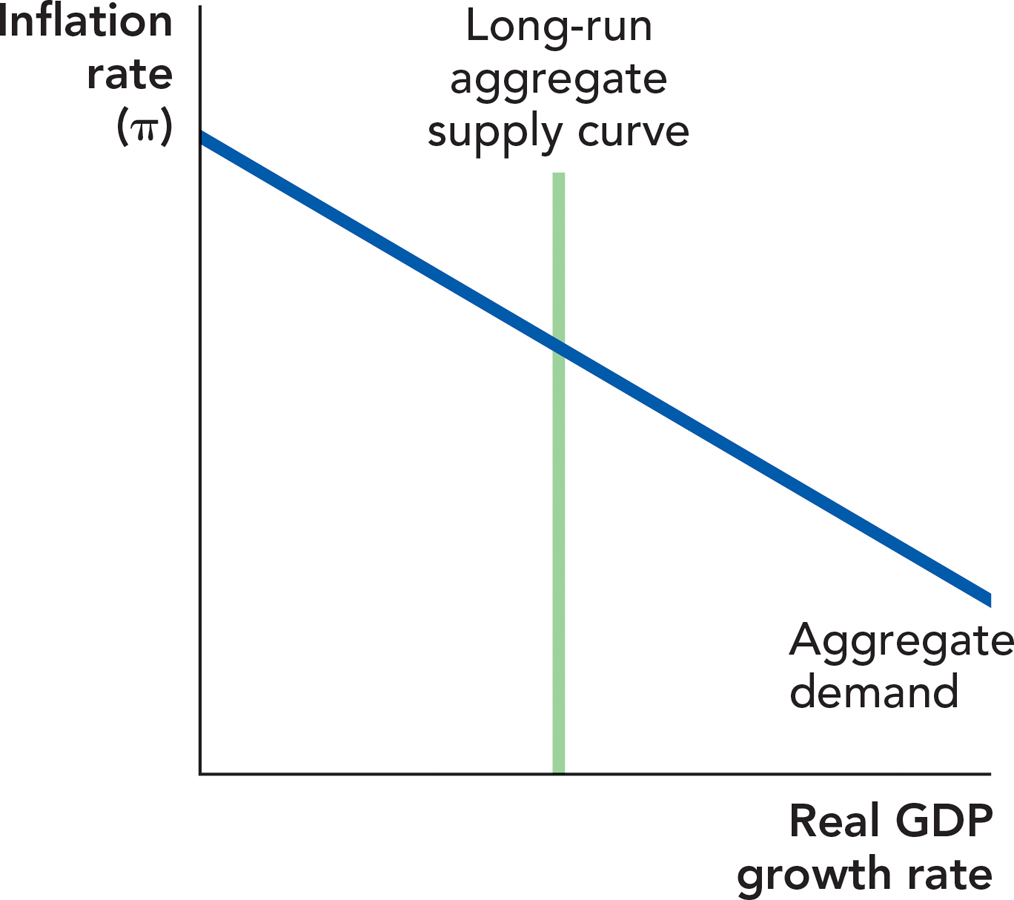
6. If the long-run aggregate supply curve increased because of a sudden fall in the price of oil, what would happen to inflation? Assume that spending growth (aggregate demand) does not change—only the LRAS curve shifts. Draw the shift in the following figure. (Note: In the real world, this happens fairly often. Big declines in the price of oil happened in 1986 and again in 1998, and the price of oil fell by 50% in late 2008.)

Question 33.8
7. Office buildings have a boom-bust cycle every day. At what hours of the weekday do grocery stores have an economic boom? What days of the week do shopping malls have an economic boom?
310
THINKING AND PROBLEM SOLVING
Question 33.9
1. In India, the economy grows faster when there’s a lot of rain and grows more slowly when there is a drought. This creates big fluctuations in the economy. If the government wrote laws to smooth out these fluctuations by paying people to work more in the dry years and by taxing people so that they would work less in the heavy-rain years, would that make the average Indian better off? Why or why not? (Keep your answer in mind during the next recession, when pundits and politicians recommend tax breaks to encourage more hiring.)
Question 33.10
2.
According to Figure Figure 32.10, about how long does it take for an oil price shock to have its biggest impact on the economy? How long does it take before the oil shock’s effects completely go away?
What might be happening in the labor market that might explain why it takes so long for an oil shock to do its worst?
(Glance through the transmission mechanisms listed in the chapter for some ideas.)
Question 33.11
3. When would a restaurant owner prefer to open a new restaurant: one year after an oil shock hits or two years after the oil shock hits?
Question 33.12
4. How is marriage like a decision to build a new factory? Which decision is easier to reverse?
Question 33.13
5.
Who would you be more likely to hire at your company: someone who has stayed in the same career for years, or someone who tries an entirely new career every time he or she becomes unhappy with their job?
How does this help explain why workers are reluctant to quickly move on to a new career when they get laid off?
Question 33.14
6. People sometimes use the expression, “Kicking the can down the road.” It refers to putting a big decision off until later—it’s almost (but not quite!) a synonym for procrastinating, and it’s usually used in a negative sense. “Fred graduated and decided to spend a year waiting tables in New York. Grad school? He’s kicking the can down the road on that one.” What economic idea is equivalent to “kicking the can down the road,” and how can it be a good thing?
Question 33.15
7. As we note in the chapter, an oil price shock will probably increase the size of an oil-centered city like Houston, Texas. During the time that people are moving to Houston, looking for jobs, and switching jobs to find the best job possible, do you think GDP will be lower than usual or higher than usual? (Try focusing on the production part of GDP in answering this question.)
Question 33.16
8. Can you think of some reasons why the following examples of time bunching and intertemporal substitution might be true? (Yes, you’ll notice that there’s a blurry line between the two.)
People who work outside work more when the weather is good.
People work when others are also working.
Even nonreligious people who don’t give gifts shop more as Christmas time approaches.
Food servers at a restaurant prefer to work the dinner shift.
What do all of these examples have to do with the business cycle?
Question 33.17
9. Consider the following economic events. Which of them will have the effect of amplifying a negative real shock and which are intended to offset a shock?
Several large financial institutions become insolvent as a housing bubble bursts and subprime mortgages begin to default in large numbers.
Many financial institutions begin issuing fewer loans and increasing their excess reserve holdings in anticipation of higher default rates on existing loans.
The Federal Reserve expands the money supply and lowers interest rates.
Instead of building for future demand, home builders delay their usual building so they can wait and see whether demand increases.
As unemployment rises, consumers begin cutting back on their expenditures and paying down personal debt.
The government passes a stimulus package increasing spending on roads and other infrastructure.
311
Firms accumulate cash reserves and delay expansion projects pending the outcome of potential government actions influencing business conditions.
Students decide to stay in college for longer periods of time due to the poor job market, and older workers retire early.
CHALLENGES
Question 33.18
1. In 1971, Intel invented the first computer microprocessor. In early 1993, the National Center for Supercomputing Applications released the first Web browser, Mosaic (which later became Netscape). Both inventions seem like good news, and both inventions created great uncertainty about which business models would succeed in the future: They were game changers. Would these uncertainty-creating inventions encourage businesses to make massive investments quickly, or would they encourage businesses to wait a few years to see how it all pans out?
Boyan Jovanovic and his coauthors discuss this topic in several papers. For an introduction, see Bart Hobijn and Boyan Jovanovic, 2001. The information-technology revolution and the stock market: Evidence. American Economic Review 91(5): 1203-1220.
Question 33.19
2. For the sake of the economy, should the government ban Christmas, and instead encourage people to give gifts throughout the year? Why or why not?
Question 33.20
3. How is the previous question similar to this question: Should the government encourage people to move from the East and West coasts to the Midwest and Rocky Mountain states, where the population is less crowded?
Question 33.21
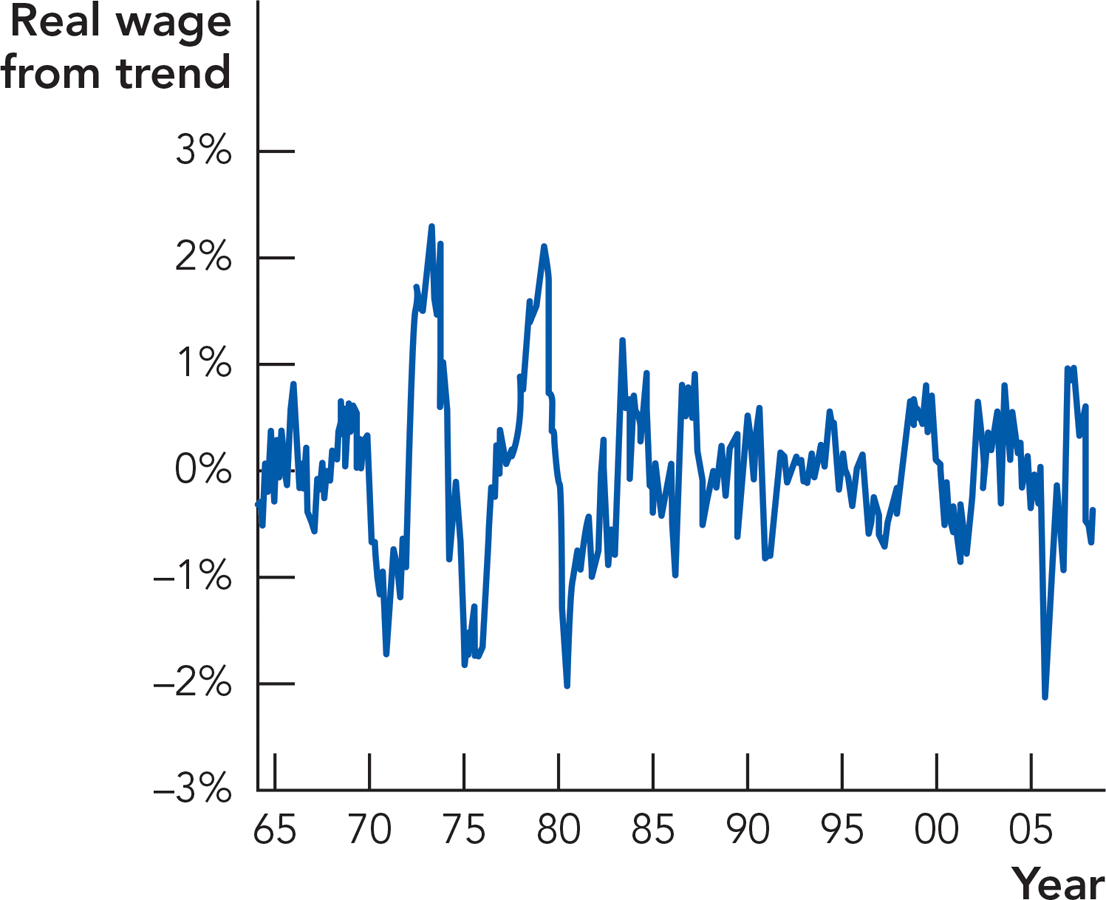
4. Do workers choose to work more because wages are temporarily high and do workers choose to work less because wages are temporarily low? This is key to the “intertemporal substitution” story of this chapter. The following chart shows how much wages change in the short run: Except in the 1970s, the moves are almost always in a 2% range, running from 1% higher than average to 1% lower than average.

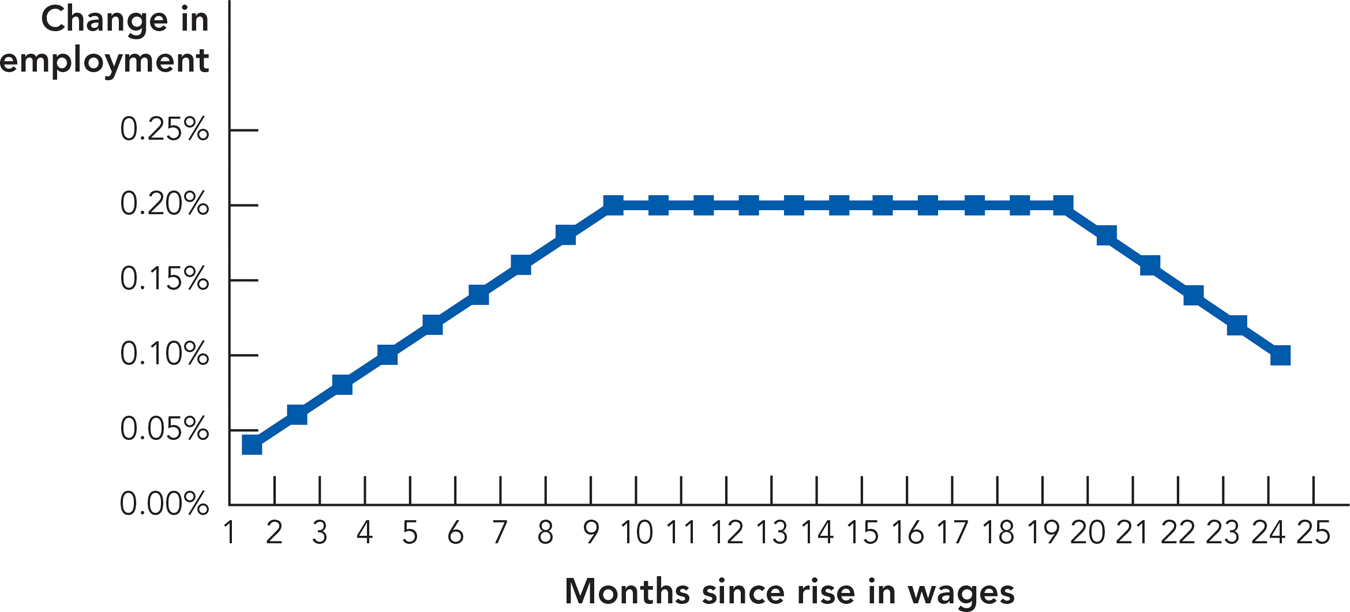
So, when wages move up or down for a year or two, does the number of Americans working move in the same direction at the same time? Let’s see. The economic simulation is based on actual U.S. data and shows how a 1% rise in wages usually impacts the number of Americans employed. Sometimes the effect is bigger than this, and sometimes smaller, but this is the average.
In practice, a 1% rise in wages apparently causes a 0.2% rise in the number of Americans with jobs. It takes nine months for this to happen.
How much would wages have to rise to raise employment by 1% or 2%, according to these estimates? (Note: This is roughly how much employment rises during a boom.) Is this “wage-channel” effect large enough to explain most of the job fluctuations we see during real-world business cycles?

312
Question 33.22
5.
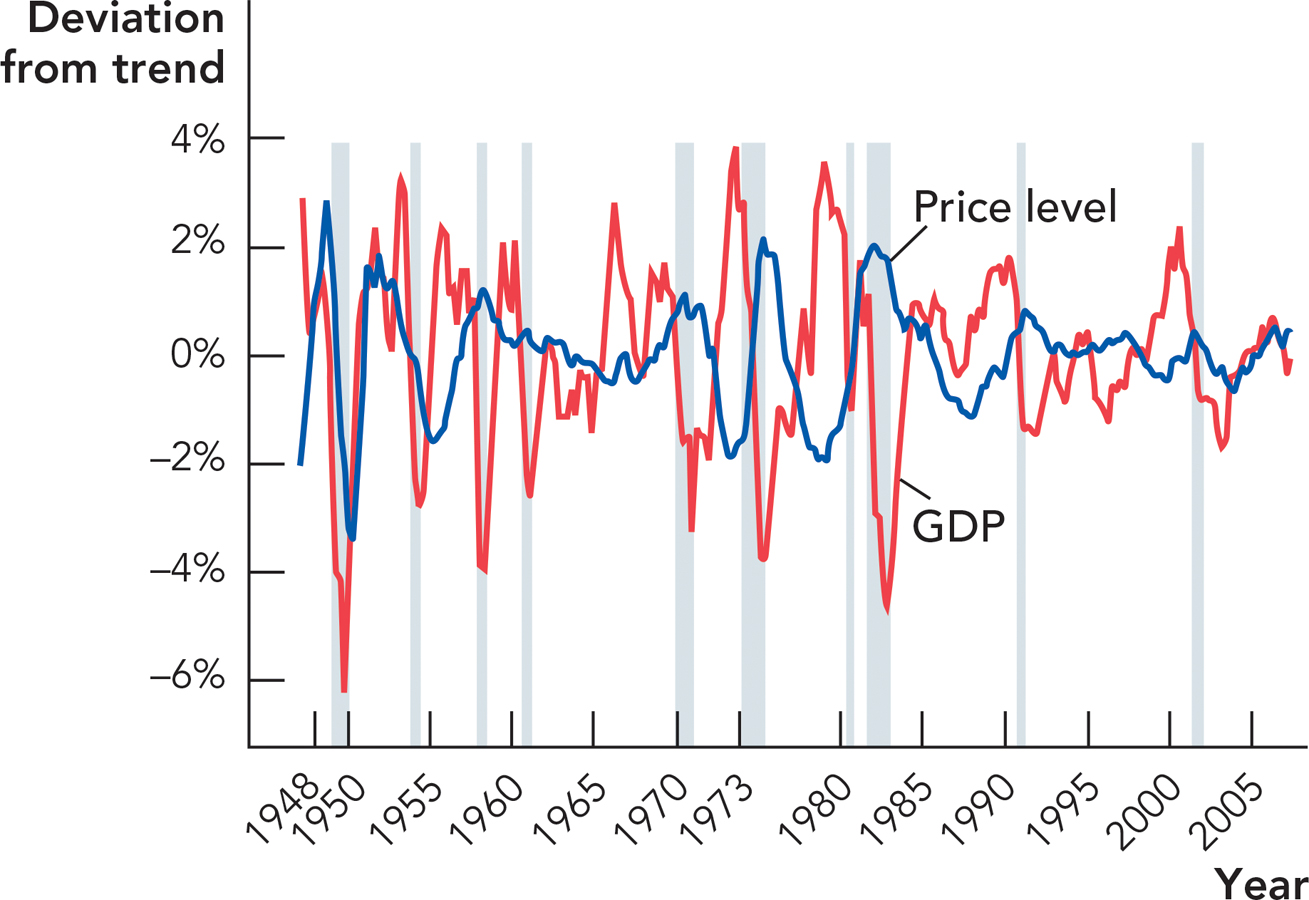
If long-run aggregate supply shocks do largely explain business fluctuation, while the aggregate demand curve mostly stays fixed, then should prices be higher than usual or lower than usual during a recession?
The following chart portrays historical U.S. data on the relationship between the price level and real GDP. If you take a look at the big swings in the 1970s and early 1980s, especially during recessions, do the data roughly suggest that long-run aggregate supply curve shocks or aggregate demand shocks were the primary disturbance?
 Source: Bureau of Economic Analysis and author calculations.
Question 33.23
6. In the context of this chapter, identify what each of the following scenarios has in common and explain how they will affect an economy suffering from a recession.
Joe and Julie married, saved, and bought a modest home several years ago when housing prices were rising. They love their home and its location, are now expecting their second child, and need more space. Financially, they can afford a larger house payment, or a second mortgage, but their bank has informed them that despite their significant down payment, they are ineligible for a home equity loan because the current value of their home has declined to below the balance on their mortgage.
A bank has many potential borrowers with good prospects but due to problems with previous real estate loans, it has begun to build up its excess reserves in order to strengthen its balance sheets in the event of defaults on those assets.
A car dealership finds itself in the path of a tornado that destroys all of its stock of both used and new cars. Sales have been good because the recession has mostly spared this region of the country, but the dealership’s insurance does not cover weather-related events and the dealer now has no assets and a negative net worth.
!launch! WORK IT OUT
In the chapter, we discussed how intertemporal substitution can amplify a boom by causing people to work more and by causing more people to work (while the reverse is true in a recession). Capital is also subject to intertemporal substitution. For example, it’s possible to run a factory at close to capacity in one period, while putting off maintenance to a later period. How do you think capacity utilization varies across the business cycle? Is capacity utilization procyclical (varies positively with GDP) or countercyclical (varies negatively with GDP)?
313