CHAPTER REVIEW
FACTS AND TOOLS
Question 37.5
1. What shifts AD to the left: a rise in taxes or a cut in taxes? Does this push  up or push it down?
Question 37.6
2. Let’s see what the “three difficulties with using fiscal policy” look like in real life. Categorize each of the following three stories as either (1) crowding out, (2) a drop in the bucket, or (3) a matter of timing.
During a recession, the State of New York hires 1,000 new trash collectors. The state legislature in Albany takes six months to pass a law to hire the new trash collectors, and because of government rules and paperwork, the government actually hires the workers 18 months after the recession has begun.
During a recession, the State of New York hires 1,000 new trash collectors. Five hundred of the new trash collectors, however, were just people who quit their jobs as restaurant employees in order to take the better paying trash collector jobs.
During a recession, the State of New York hires 1,000 new trash collectors. However, during the course of the recession, 300,000 additional people in New York lose their jobs.
Question 37.7
3. When people “buy government bonds,” are they borrowing money or saving money?
Question 37.8
4. Imagine you live in the land of Ricardia, where every citizen is a Ricardian and thus “Ricardian equivalence” is 100% true. Government spending never changes in Ricardia: It’s a fixed amount every year. Thus, when the Ricardian government cuts taxes, it has to pay for the government spending by borrowing more money and raising future taxes to repay the debt.
When Ricardian income taxes are cut, what will Ricardian citizens do with the extra money in their paycheck: Will they spend all of it, save all of it, or spend some and save the rest?
Suppose that instead of a tax cut, the Ricardian government just sends citizens “rebate” checks. What will Ricardian citizens do with the extra money from these rebate checks: Will they spend all of it, save all of it, or spend some and save the rest?
Question 37.9
5. It’s often very difficult to get the timing of fiscal policy right. In this chapter, we listed five relevant lags.
If each of the lags lasts three months, is the total lag longer or shorter than the typical recession since World War II? For data on the length of recessions, go to: http://www.nber.org/cycles.html. Look at the bottom of the column titled “Contraction.”
Of the five lags, the last one only involves watching how things turned out. If there are only four important lags, and they last three months each, will the average recession last longer than the average fiscal policy lag?
Question 37.10
6. You’re flipping through the newspaper, reading about shocks that have hit the U.S. economy and reading what Congress is planning to do about the shocks. (Remember that “shocks” can be either good or bad.) Is Congress even getting the direction of its response right? And if it is getting the basic direction correct, is it fighting against a long-run aggregate supply shock, where a fiscal response may not be very effective? While these policy choices will each have effects on long-run growth and on income distribution, in this chapter you should focus only on the effect on aggregate demand. Fit each of the following cases into one of three categories:
Wrong direction
Correct direction for an AD shock
Correct direction for a long-run aggregate supply shock, but expect a big change in inflation
Many banks have failed, and the money supply has fallen. In response, Congress decides to raise income taxes to pay down the federal debt. (Historical note: This policy response was similar to FDR’s campaign platform when he ran for president in 1932.)
405
Many banks have failed, and the money supply has fallen. In response, Congress decides to cut back on government purchases to save money.
A wave of investor euphoria (“irrational exuberance”) about the Internet has increased spending growth. Congress raises income taxes on the richest Americans in response.
Oil prices double over the course of a year, from $3 per gallon to $6 per gallon. In response, Congress sends $300 checks to every American family so that people can better afford to pay for gas.
Oil prices double over the course of a year, from $3 per gallon to $6 per gallon. In response, Congress raises taxes on companies that refine and deliver petroleum products.
The Federal Reserve has followed a slow-money-growth policy, despite the wishes of Congress. In response, Congress cuts taxes and increases government purchases.
Question 37.11
7. Which of the following is an “automatic stabilizer” in the U.S. economy? There may be more than one:
Consumers usually spend some of their savings and eat food from the pantry during recessions.
Business owners usually purchase more capital equipment whenever profits fall.
Governments automatically transfer cash to the unemployed when the economy is weak.
When Americans have less demand for U.S. manufactured products, foreigners might pick up some of the slack, buying these unsold U.S.-made goods.
Question 37.12
8. Why was the Great Depression an especially appropriate time to use fiscal policy rather than just monetary policy alone?
Question 37.13
9. If the U.S.-debt-to-GDP ratio were 100% and if the interest rate on the debt were 5% (not far from the truth at present), then what fraction of U.S. GDP would go toward paying interest on the debt? (Note: After World War II, U.S. debt was greater than 100% of GDP.)
Question 37.14
10. Which kind of aggregate demand shift has fewer lags: changes in monetary policy or changes in fiscal policy?
THINKING AND PROBLEM SOLVING
Question 37.15
1.
In the chapter, we wrote that Tyler does not save and plan according to the theory of Ricardian equivalence but Alex is more of a “Ricardian.” In light of this, who probably cuts back their spending the most when taxes temporarily rise: someone like Tyler who is not “Ricardian” or someone like Alex who is?
If the U.S. government wants to use fiscal policy to shift AD around easily, which one would the U.S. government prefer to make more copies of: Tyler or Alex?
Question 37.16
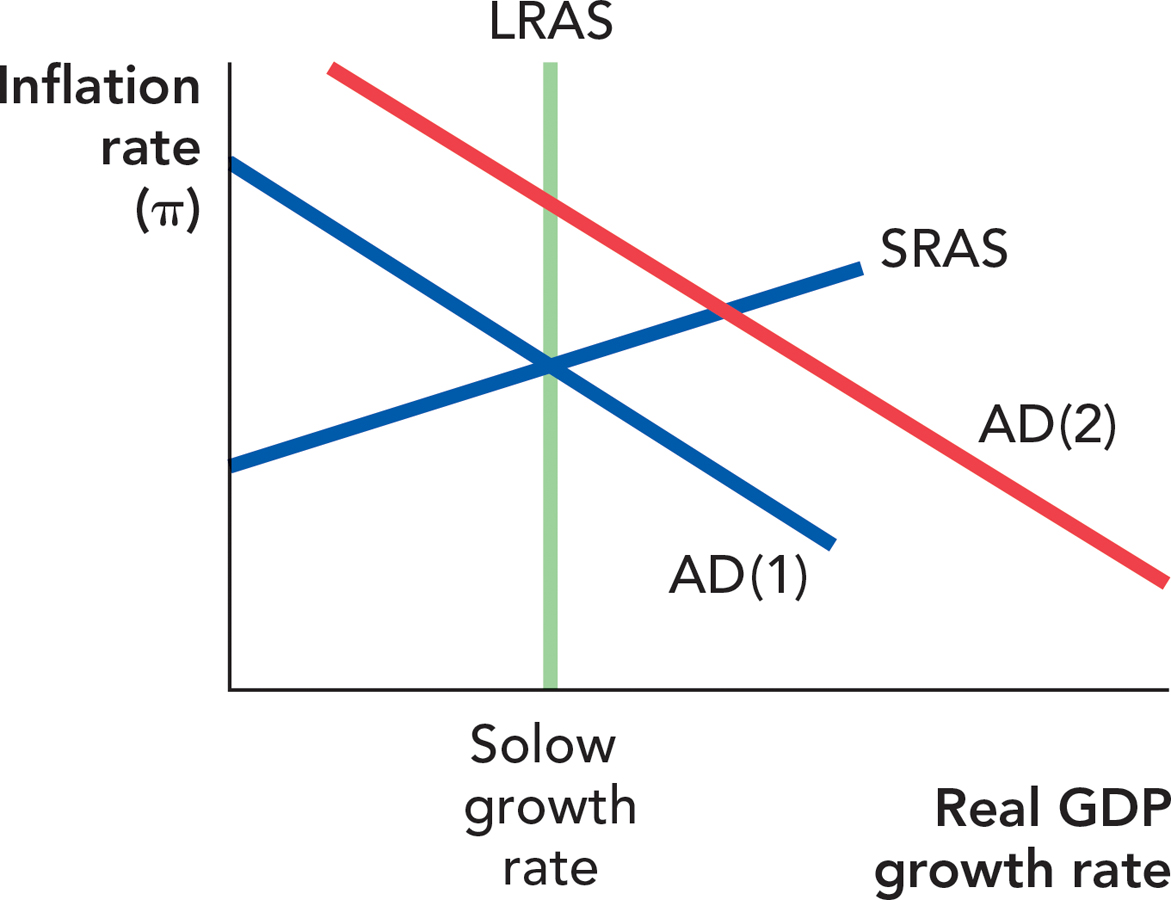
2. Using the following figure, suppose that a change in fiscal policy shifts AD from AD(1) to AD(2). Which response would be most likely to cause that shift? Choose one of a, b, c, or d.
A rise in taxes OR a rise in government spending
A rise in taxes OR a fall in government spending
A fall in taxes OR a rise in government spending
A fall in taxes OR a fall in government spending
Question 37.17
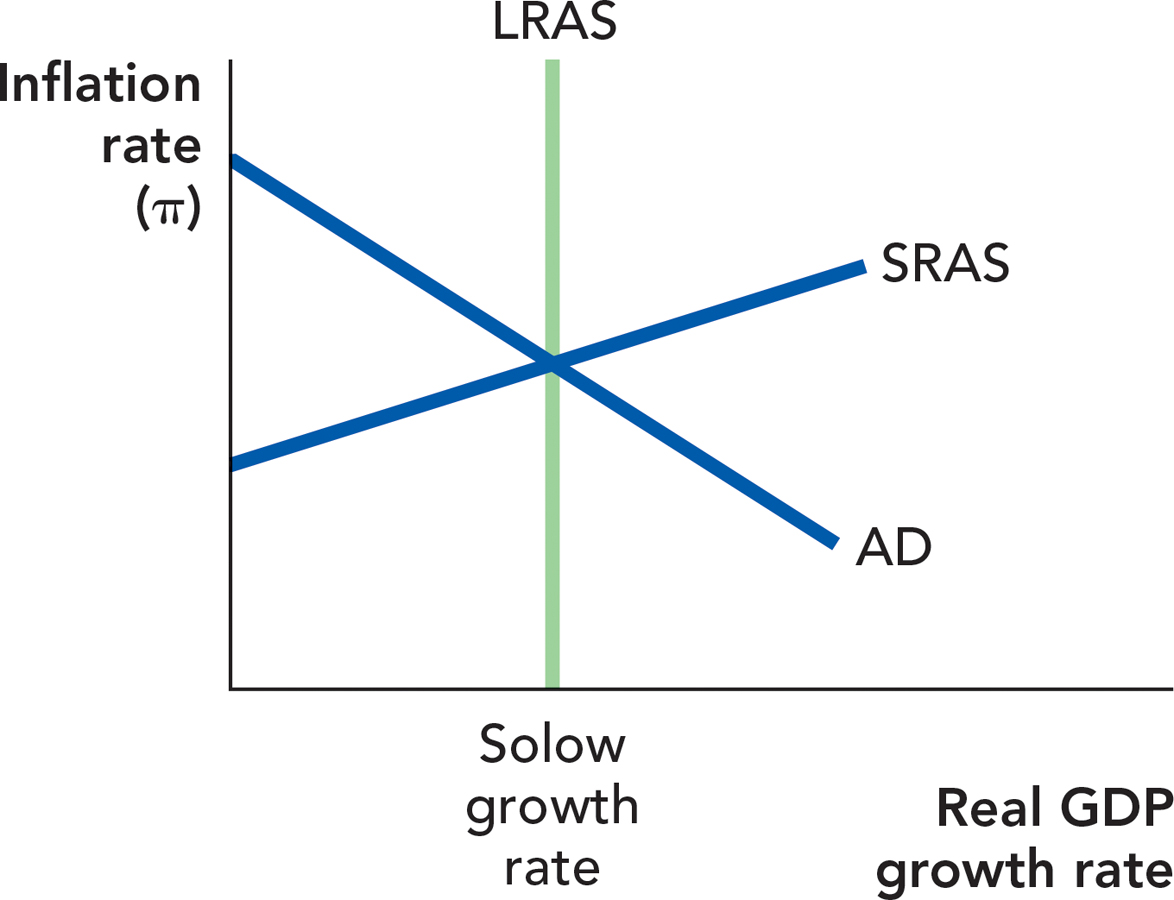
3. Consider the following figure. Suppose that there’s a rise in due to business optimism— what Keynes called the “animal spirits” of investors. This pushes us to AD(2). If the government’s goal is to keep output close to the long-run aggregate supply growth rate, and if fiscal policy is the tool that the government wants to use, what should it do? Choose one of a, b, c, or d.
406
A rise in taxes OR a rise in government spending
A rise in taxes OR a fall in government spending
A fall in taxes OR a rise in government spending
A fall in taxes OR a fall in government spending

Question 37.18
4. Consider the following imaginary newspaper quote, the type that you often read when Congress passes a tax rebate during a recession:
“Many Americans report that they will put the tax rebate straight into their savings accounts or use it to pay off credit cards that they maxed out during the recent economic boom.”
If Congress is trying to shift AD to the right, are these kinds of quotes good news or bad news from Congress’s point of view?
Question 37.19
5. Which of the following government policies are “automatic stabilizers” for the economy?
Unemployment insurance
Temporary tax cuts that Congress passes when bad economic news hits
Temporary spending increases that Congress passes when bad economic news hits
Question 37.20
6.
Which policy is likely to shift aggregate demand more? In which direction will it shift?
A tax increase that occurs in the same year as a spending increase
A tax increase that occurs without a spending increase
Why is this so?
Question 37.21
7. Ricardian equivalence is the idea that people might just use the extra money from their tax cuts to buy the very government bonds that pay for the tax cut. Let’s think about the opposite situation: If Ricardian equivalence is true, and the government raises taxes (holding spending constant), how does the average person’s behavior change? In other words, how does he or she react to a tax increase?
Question 37.22
8. Again, think about the extreme case of crowding out known as “Ricardian equivalence.” In real life, few citizens buy or sell government bonds directly; instead, normal people put their money in a bank (or invest it in a mutual fund), and then their bank (or mutual fund) uses that money to buy government bonds.
So does a tax cut mean banks will get more deposits, fewer deposits, or can’t you tell with the information given?
How will the average bank’s behavior change as a result of this tax cut, taking your response to part a into account?
Question 37.23
9. We discussed three situations where fiscal policy is most likely to matter (though fiscal policy is best when all three are true):
When the economy needs a short-run boost
When the problem is low AD, not low LRAS
When many machines and workers are unemployed
Let’s fit each of the following news stories into one (or more) of the above categories.
World War II ends, and millions of U.S. soldiers return home. (Note: As a matter of history, returning World War II soldiers were overwhelmingly employed by the private sector.)
Consumption spending declines dramatically as people fear a recession.
Foreigners decide they are unwilling to buy U.S.-made airplanes because of rumors they read on the Internet.
Question 37.24
10. Fiscal policy cannot cure all ills. Sometimes:
X. The economy needs a long-run boost.
Y The problem isn’t low AD, but low LRAS growth.
Z. Almost all machines and workers are employed; they’re just not very productive.
407
Sort the following cases into either “fiscal solution possible” or “productivity problem”:
American wages have grown slowly for many years.
Peasants in the Middle Ages are using primitive tools to produce food.
Peasants in the Middle Ages suffer from a drought that hurts the season’s crops.
American workers get laid off by the hundreds of thousands because of a rapid collapse in investment purchases.
Schools are doing a bad job teaching students, so students become ineffective employees.
High taxes on investment discourage people from saving and building up the capital stock for future workers to use.
High taxes on investment discourage businesses from purchasing investment goods.
CHALLENGES
Question 37.25
1. When we discussed unemployment in Chapter 30, we noted that people will search a long time to find a good job. So it might only take you two weeks to find a minimum wage job, but it might take you six months to find a job paying five times the minimum wage. Let’s investigate how this simple fact might cause expansionary fiscal policy to increase the unemployment rate, at least temporarily.
In the United States, federal contracts to build roads, bridges, or buildings must pay higher-than-average wages. The law requiring this is known as the Davis-Bacon Act, or the “prevailing wage law.”
If the unemployment rate is 6% before a rise in government purchases, and if a rise in government purchases induces the typical unemployed person to search 10% longer in the hopes of finding a high-paying government job, what will the unemployment rate be after the rise in government purchases? Only consider the impact of this waiting-for-a-good-job effect.
If the government wanted to get the good aggregate-demand-stimulating effects of fiscal policy, but wanted to eliminate this extra waiting-for-a-good-job unemployment, how could it change current law to do so?
Question 37.26
2. Nobel Laureate Amartya Sen has pointed out that one way to prevent starvation during droughts in the poorest countries is to just pay peasants to build roads, sewer lines, and other public goods during these droughts. In the poorest countries, these peasants have no savings accounts, and almost no way to borrow money. In rich countries by contrast, most people have savings accounts and credit cards.
Is the poor-country “multiplier” probably bigger or smaller than the rich-country multiplier, based on these facts?
All countries get hit by shocks, but not all countries have the same automatic stabilizers. Based on these facts, which countries probably have smoother GDP growth: poor countries or rich countries? (Note: The answer that is true in theory is also true in practice, a point emphasized in a 1995 paper in the American Economic Review by Garey and Valerie Ramey, “Cross-Country Evidence on the Link between Volatility and Growth.”)
Question 37.27
3. If the U.S. government wanted to, it could just say that everyone who is unemployed is “employed in the job search” and receiving a paycheck for this “work,” and the government could claim that these government employees are producing “job search services.” Recall that in the official definition of GDP, government purchases (G), do not include transfer payments like unemployment checks and Social Security.
Would this change in the definition of GDP increase GDP? Would it improve well-being?
If the government permanently defined unemployed people as “employed in job search,” then over the course of a few decades as the economy fluctuated, would GDP look more volatile or less volatile than it does under the regular definition?
(Hint: You might find it easier to answer if you consider GDP from the “factor income” perspective.)
Question 37.28
4. We usually think about crowding out as a decrease in private consumption or investment in response to an increase in government purchases. But the idea works in reverse as well, an idea we might call “crowding in.” Consider the following economy.
408
Starting from this initial position, the economy is hit by one shock: a large decrease in government purchases, perhaps caused by the end of a war. Holding the growth of C, I, and NX constant for a moment, illustrate this shock, labeling the change “Fall in growth of G.”
Now consider a possible side effect of the fall in the growth of G: the reversal of crowding out or crowding in. If there is 100% crowding in, what happens to the AD shift you described in part a?
If there were 100% crowding out/in and no multiplier effect, what can we say about the effect of a change in the growth of G on aggregate demand?
Consider all of the laid-off government workers in this question: If there were 100% crowding out/in and no multiplier effect, where do these laid-off workers end up?
Question 37.29
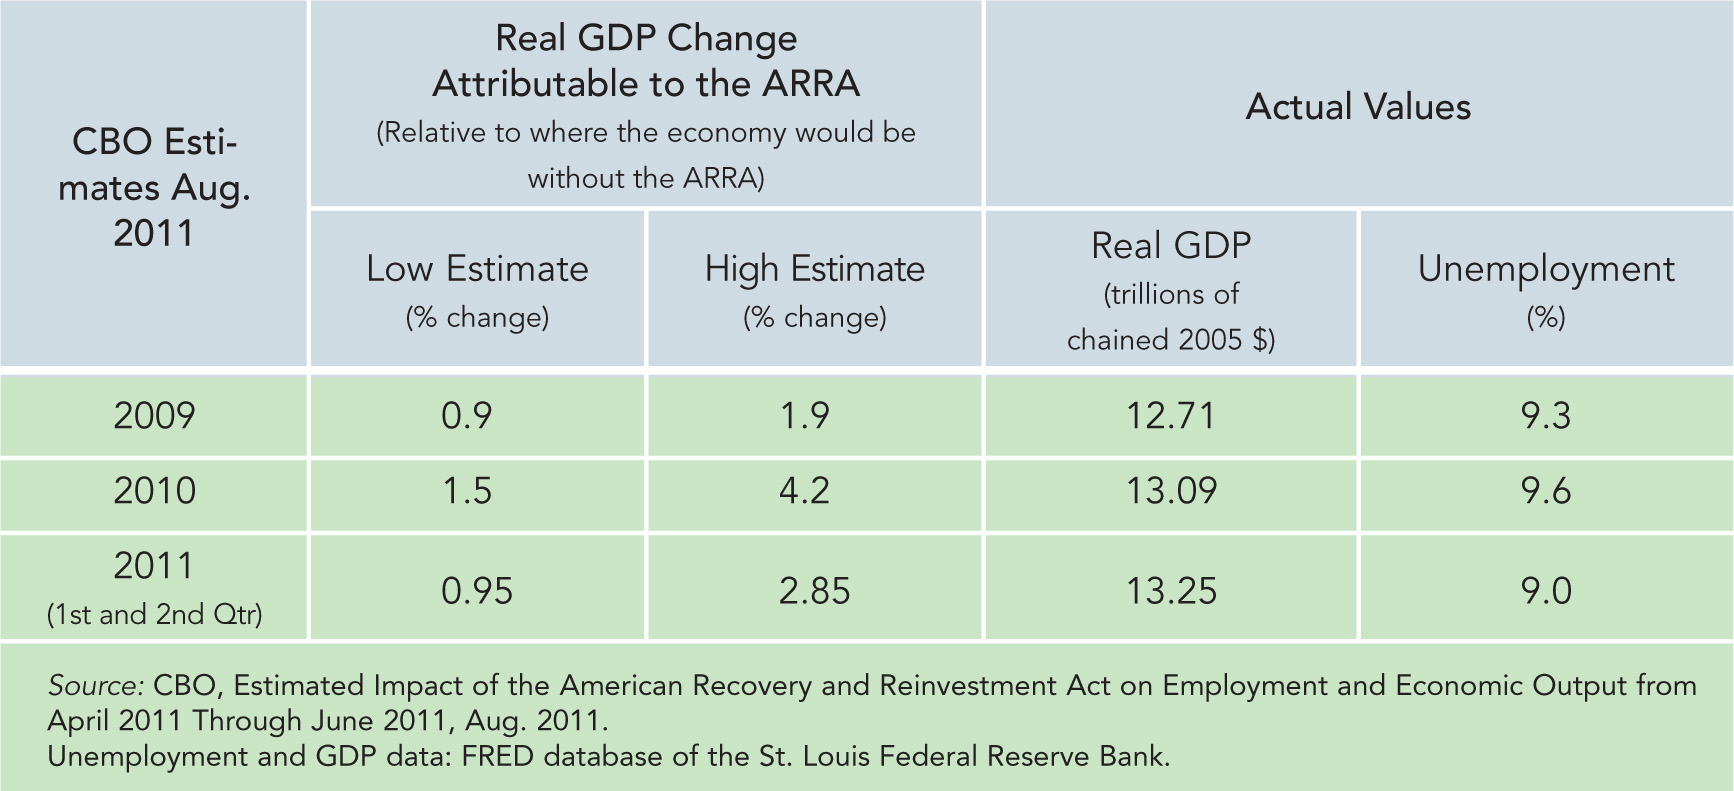
5. In February of 2009, Congress passed the American Recovery and Reinvestment Act (ARRA). When this stimulus package was signed into law, White House officials projected that it would create, or at least save, 3.5 million jobs, prevent the unemployment rate from rising above 8%, and have a multiplier effect on GDP of 1.57 after 10 quarters. Prior to the bill’s signing, unemployment was at a 25-year high of 7.8%. (It had also reached 7.8% during one month in 1992.) In August of 2011, the Congressional Budget Office (CBO) estimated where the economy was at the end of June that year relative to where it would have been in the absence of the stimulus spending. Some of its findings are given in the table below. The low and high estimates under Real GDP define the range of how much greater in percentage terms real GDP was because of the stimulus spending than it would have been without it. The CBO also revised its estimate of the stimulus cost at $825 billion instead of the $787 billion projected at the time of the bill’s signing and estimated that about half the impact occurred during 2010 with about 85% of it realized by the end of June 2011.
The 85% of the $825 billion stimulus package spent by the end of the second quarter in 2011, amounting to $701.3 billion, was funded through deficit financing and added to the national debt. For comparison to the real GDP figures, $701.3 billion when adjusted for inflation becomes $677.6 billion.
For each year, use the real GDP figures in the table below and the low and high percentage estimates of the effect of the stimulus to calculate low and high estimates for the dollar effect of the stimulus.
Determine the midpoint of that range for each year and calculate a rough estimate of the total amount of real GDP generated by the stimulus spending for the ten quarters given in the table.
Compare the amount you calculated in part b to the inflation-adjusted stimulus expenditures of $677.6 billion for the same period and determine if those expenditures appear to have had a multiplier effect, no effect, or generated some crowding out.
How do your findings vary if you use the lower or the upper ends of the range of increased real GDP estimated by the CBO? If multipliers were this simple to generate, which they are not, what do these estimates suggest their sizes might be?
Use the chapter material describing the limits to fiscal policy to explain why the size of the impact you found in part c varied from the 1.57 multiplier effect forecasted by the White House at the time of the ARRA legislation.
Does the American Recovery and Reinvestment Act of 2009 qualify as one of the times when fiscal policy was a good idea? Defend your answer using economic support from the chapter.
409
!launch! WORK IT OUT
According to recent estimates by Susan Woodward and Robert Hall, an extra dollar of government purchases raises GDP by one dollar—so there is little evidence for a “multiplier effect” in the short run, but also little evidence for “crowding out” in the short run. (Perhaps both effects are at work, but they just happen to balance out in practice.) Let’s use these estimates as a rule of thumb to solve the following economic puzzles:
U.S. GDP is about $14 trillion. In a typical recession, GDP is about 2% below the Solow growth rate as given by the LRAS curve. If Congress wants to return growth to the Solow growth rate and thus move the economy back onto the LRAS curve by increasing government purchases, how big a rise in government purchases should it enact? Give your answer in dollars.
Canadian GDP is about $1.2 trillion (U.S. dollars). If Canadian GDP is 3% above its Solow growth rate, and the Canadian Parliament wants to change government purchases to return to the Solow growth rate, what change in government purchases should it enact, measured in U.S. dollars?
How do your answers to parts a and b change if there’s stronger crowding out, and the multiplier falls to 0.5? (In other words, a rise in G of $1 raises GDP by only $0.50.) Answer in U.S. dollars.
How do your answers to parts a and b change if there’s a bigger multiplier effect on consumer spending, and the multiplier rises to 2? (In other words, a rise in G of $1 raises GDP by $2.) Answer in U.S. dollars.
410