The Demand Curve for Oil
A demand curve is a function that shows the quantity demanded at different prices.
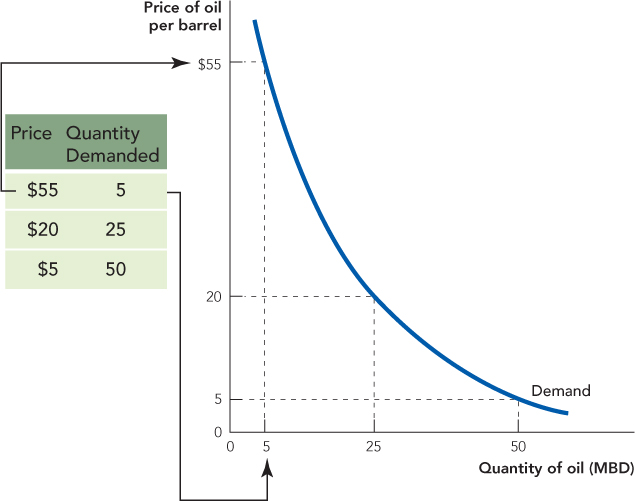
How much oil would be demanded if the price of oil were $5 per barrel? What quantity would be demanded if the price were $20? What quantity would be demanded if the price were $55? A demand curve answers these questions. A demand curve is a function that shows the quantity demanded at different prices.
In Figure 3.1, we show a hypothetical demand curve for oil and a table illustrating how a demand curve can be constructed from information on prices and quantities demanded. The demand curve tells us, for example, that at a price of $55 per barrel buyers are willing and able to buy 5 million barrels of oil a day or, more simply, at a price of $55 the quantity demanded is 5 million barrels a day (MBD).
28

The quantity demanded is the quantity that buyers are willing and able to buy at a particular price.
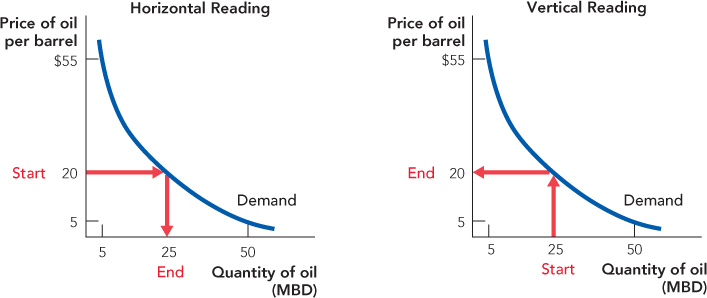
Demand curves can be read in two ways. Read “horizontally,” we can see from Figure 3.2 that at a price of $20 per barrel demanders are willing and able to buy 25 million barrels of oil per day. Read “vertically,” we can see that the maximum price that demanders are willing to pay for 25 million barrels of oil a day is $20 per barrel. Thus, demand curves tell us the quantity demanded at any price or the maximum willingness to pay (per unit) for any quantity. Some applications are easier to understand with one reading than with the other so you should be familiar with both.
Ok, a demand curve is a function that shows the quantity that demanders are willing to buy at different prices. But what does the demand curve mean? And why is the demand curve negatively sloped; that is, why is a greater quantity of oil demanded when the price is low?

Introduction to Demand
http://qrs.ly/en4ax64
Oil has many uses. A barrel of oil contains 42 gallons, and a little over half of that is used to produce gasoline (19.5 gallons) and jet fuel (4 gallons). The remaining 18.5 gallons are used for heating and energy generation and to make products such as lubricants, kerosene, asphalt, plastics, tires, and even rubber duckies (which are actually made not from rubber but from vinyl plastic).
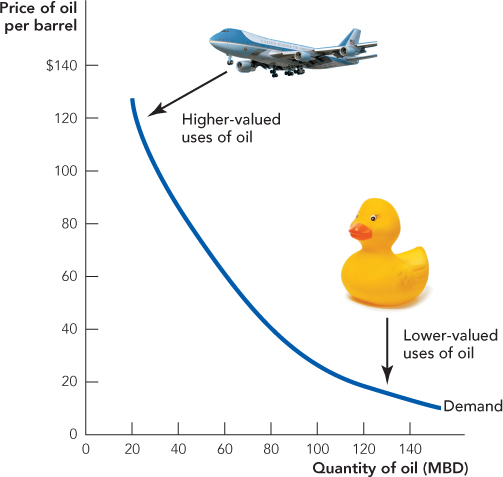
Oil, however, is not equally valuable in all of its uses. Oil is more valuable for producing gasoline and jet fuel than it is for producing heating or rubber duckies. Oil is very valuable for transportation because in that use oil has few substitutes. There is no reasonable substitute for oil as jet fuel, for example, and although some hybrids like the Prius are moderately successful, pure electric cars like the Tesla remain costly. There are more substitutes for oil in heating and energy generation. In these fields, oil competes directly or indirectly against natural gas, coal, and electricity. Within each of these fields there are also more and less valuable uses. It’s more valuable, for example, to raise the temperature in your house on a winter’s day from 40 degrees to 65 degrees than it is to raise the temperature from 65 degrees to 70 degrees. Vinyl has high value as wire wrapping because it is fire-retardant, but we can probably substitute wooden toy boats for rubber duckies.
29

Horizontal Reading: At a price of $20 per barrel, buyers are willing to buy 25 million barrels of oil per day.
Vertical Reading: The maximum price that demanders are willing to pay to purchase 25 million barrels of oil per day is $20 per barrel.
The fact that oil is not equally valuable in all of its uses explains why the demand curve for oil has a negative slope. When the price of oil is high, consumers will choose to use oil only in its most valuable uses (e.g., gasoline and jet fuel). As the price of oil falls, consumers will choose to also use oil in its less and less valued uses (heating and rubber duckies). Thus, a demand curve summarizes how millions of consumers choose to use oil given their preferences and the possibilities for substitution. Figure 3.3 illustrates these ideas with a demand curve for oil.

(Bottom: Lew Robertson/Corbis)
In summary, a demand curve is a function that shows the quantity that demanders are willing and able to buy at different prices. The lower the price, the greater the quantity demanded—this is often called the “law of demand.”
30