Shifting Demand and Supply Curves
Another way of testing the supply and demand model is to examine the model’s predictions about what happens to equilibrium price and quantity when the supply or demand curves shift. Even if the model doesn’t give us precise predictions (outside the lab), we can still ask whether the model helps us to understand the world.
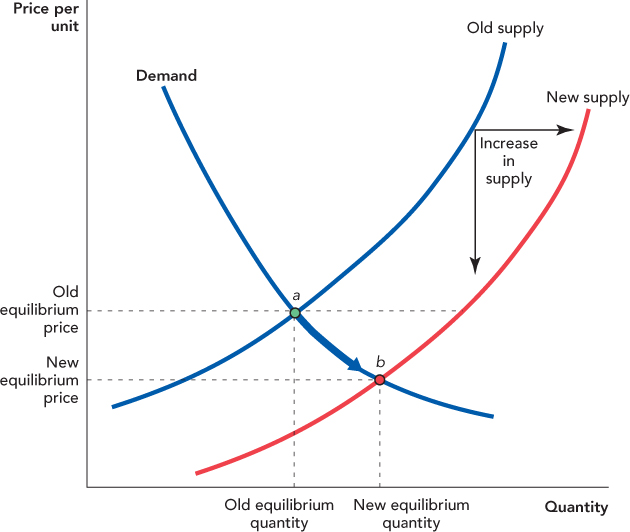
Imagine, for example, that technological innovations reduce the costs of producing a good. As we know from Chapter 3, a fall in costs shifts the supply curve down and to the right as shown in Figure 4.6. The result of lower costs is a lower price and an increase in quantity. Begin at the Old Equilibrium Price and Quantity at point a. Now a decrease in costs shifts the Old Supply curve down and to the right out to the New Supply curve. Notice at the Old Equilibrium Price there is now a surplus—in other words, now that their costs have fallen, suppliers are willing to sell more at the old price than demanders are willing to buy. The excess supply, however, is temporary. Competition between sellers pushes prices down, and as prices fall, the quantity demanded increases. Prices fall and quantity demanded increases until the New Equilibrium Price and Quantity are established at point b. At the new equilibrium, the quantity demanded equals the quantity supplied.
55

We can see this process at work throughout the economy. As technological innovations reduce the price of computer chips, for example, prices fall and the quantity of chips—used in everything from computers to cell phones to toys—increases.
What about a decrease in supply? A decrease in supply will raise the market price and reduce the market quantity, exactly the opposite effects to an increase in supply. But don’t take our word for it. Draw the diagram. The key to learning demand and supply is not to try to memorize everything that can happen. Instead, focus on learning how to use the tools. If you know how to use the tools, then simply by drawing a few pictures, you can deduce what happens to price and quantity for any configuration of demand and supply and for any set of shifts.
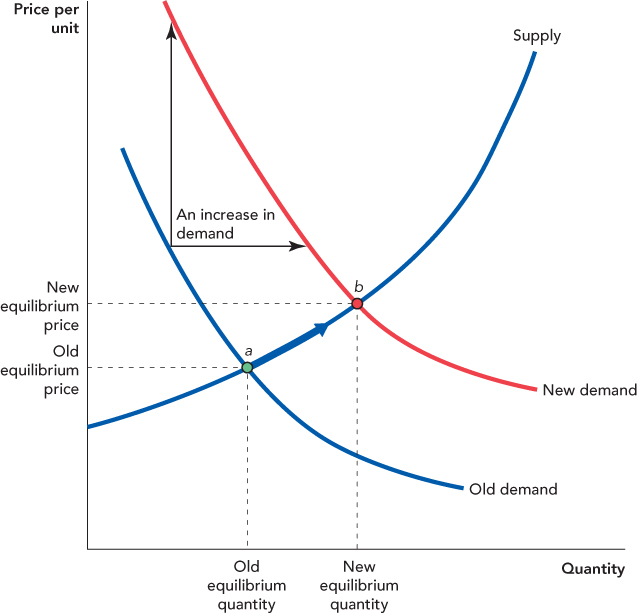
Figure 4.7 shows the same process for an increase in demand. Begin with the Old Equilibrium Price and Quantity at point a. Now suppose that demand increases to New Demand. As a result, the price and quantity are driven up to the New Equilibrium Price and Quantity at point b. Notice this time we omitted discussion of the temporary transition. So here’s a good test of your knowledge. Can you explain why the price and quantity demanded increased with an increase in demand? (Hint: What happens at the Old equilibrium price after demand has increased to New demand?)

56
CHECK YOURSELF
Question 4.6
 Flooding in Iowa destroys some of the corn and soybean crop. What will happen to the price and quantity for each of these crops?
Question 4.7
 Resveratrol, which is found in the plant Japanese knotweed (and is also a component of red wine), has recently been shown to increase life expectancy in worms and fish. What are your predictions about the price and quantity of Japanese knotweed grown?
Question 4.8
 With the increase in gasoline prices, demand has shifted away from large cars and SUVs, and toward hybrid cars such as the Prius. Draw a graph showing the supply and demand for hybrid cars before and after an increase in the price of gasoline. What do you predict will happen to the price of hybrids as the price of gasoline rises?
Of course, if we can analyze an increase in demand, then a decrease in demand is just the opposite: A decrease in demand will tend to decrease price and quantity. Once again, draw the diagram!
Do you recall the list of demand and supply shifters that we presented in Chapter 3? We can now put all that knowledge to good use. With demand, supply, and the idea of equilibrium, we have powerful tools for analyzing how changes in income, population, expectations, technologies, input prices, taxes and subsidies, alternative uses of industry inputs, and other factors will change market prices and quantities. In fact, with our tools of demand, supply, and equilibrium, we can analyze and understand any change in any competitive market.