Terminology: Demand Compared with Quantity Demanded and Supply Compared with Quantity Supplied
Sometimes economists use very similar words for quite different things. (We’re sorry but unfortunately it’s too late to change terms.) In particular, there is a big difference between demand and quantity demanded. For example, an increase in the quantity demanded is a movement along a fixed demand curve. An increase in demand is a shift of the entire demand curve (up and to the right).
57
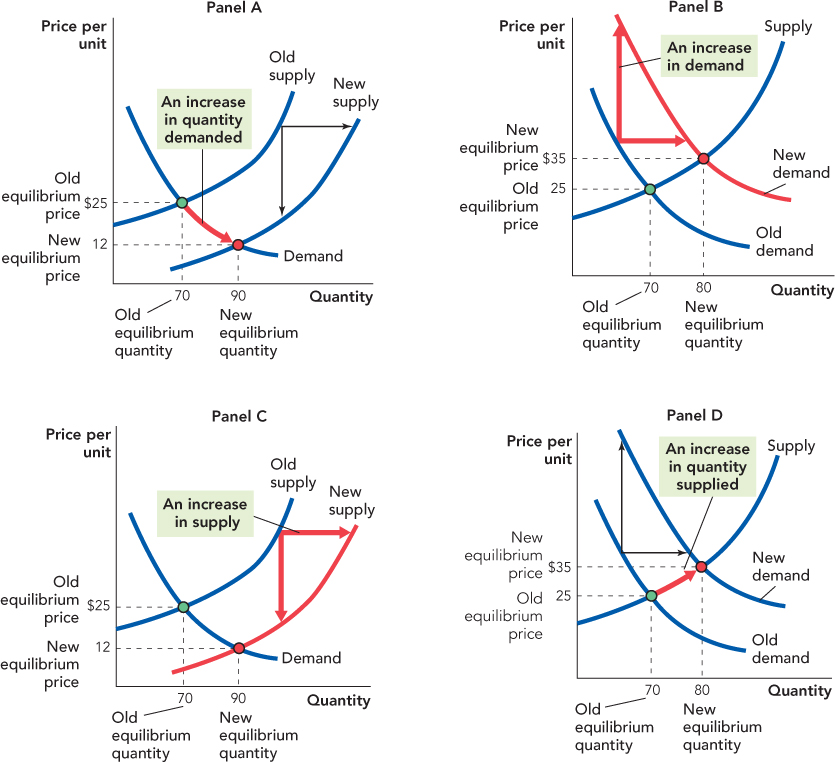
Don’t worry: You are already familiar with these differences; we just need to point them out to you and explain the associated differences in terminology. Panel A of Figure 4.8 is a repeat of Figure 4.6, showing that an increase in supply reduces the equilibrium price and increases the equilibrium quantity. But now we emphasize something a little different—the increase in supply pushes the price down, thereby causing an increase in the quantity demanded from 70 units to 90 units. Notice that the increase in the quantity demanded is a movement along the demand curve. In panel A, the demand has not changed, only the quantity demanded. Notice also that changes in the quantity demanded are always caused by changes in supply. In other words, shifts in the supply curve cause movements along the demand curve.

Panel A: An increase in quantity demanded is a movement along a fixed demand curve caused by a shift in the supply curve.
Panel B: An increase in demand is a shift in the demand curve up and to the right.
Panel C: An increase in supply is a shift in the supply curve down and to the right.
Panel D: An increase in quantity supplied is a movement along a fixed supply curve caused by a shift in the demand curve.
58
Panel B is a repeat of Figure 4.7 and it shows an increase in demand. Notice that an increase in demand is a shift in the entire demand curve up and to the right. Indeed, we can also think about an increase in demand as the creation of a new demand curve, appropriately labeled New Demand.
Similarly, an increase in supply is a shift of the entire supply curve, whereas an increase in quantity supplied is a movement along a fixed supply curve. If you look closely at panels A and B, you will see that we have already shown you a shift in supply and a change in quantity supplied! But to make things clear, we repeat the analysis for supply in panels C and D: The graphs are the same but now we emphasize different things.
Panel C shows an increase in supply, a shift in the entire supply curve down and to the right. Panel D shows an increase in quantity supplied, namely a movement from 70 to 80 units along a fixed supply curve.
By comparing panels A and C, we can see that shifts in the supply curve create changes in quantity demanded. And by comparing panels B and D, we can see that shifts in the demand curve create changes in the quantity supplied.