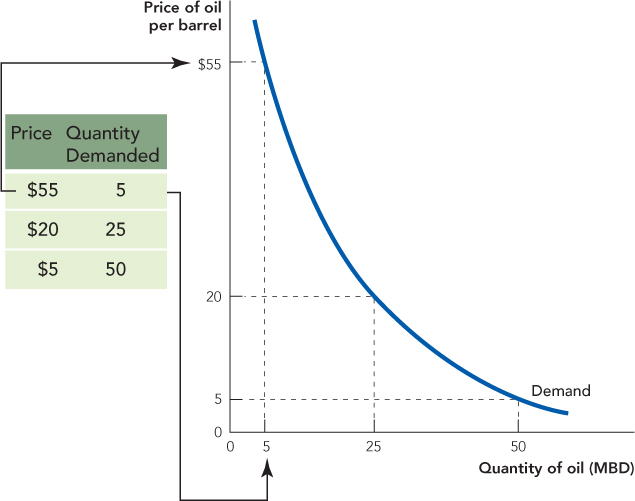
FIGURE 3.1

The Demand Curve for Oil Is a Function Showing the Quantity of Oil Demanded at Different Prices If the price of oil was $55 per barrel, the quantity d emanded would be 5 million barrels of oil per day. If the price was $20 per barrel, what would the quantity demanded be?
[Leave] [Close]