13 Business Fluctuations: Aggregate Demand and Supply
CHAPTER OUTLINE
The Aggregate Demand Curve The Long-Run Aggregate Supply Curve Real Shocks
Aggregate Demand Shocks and the Short-Run Aggregate Supply Curve
Shocks to the Components of Aggregate Demand
Understanding the Great Depression: Aggregate Demand Shocks and Real Shocks
Takeaway
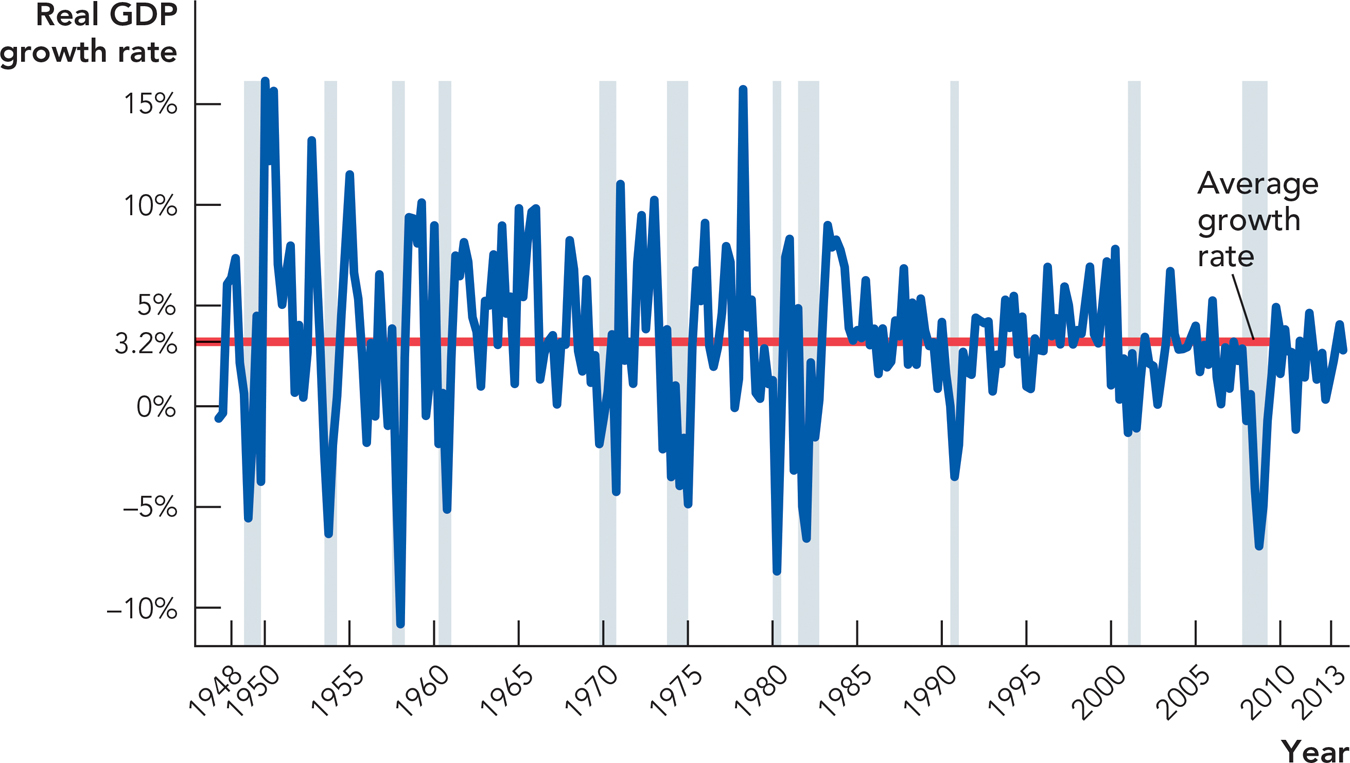
Economic growth is not a smooth process. Real GDP in the United States has grown at an average rate of 3.2% per year over the past 60 years. But the economy didn’t grow at this rate every day or every month or even every year. The economy advances and recedes, it rises and falls, it booms and busts.
In Chapter 7 and Chapter 8, we looked at why some countries are rich and others are poor. In answering that question, we could safely ignore booms and recessions and focus on average rates of growth over periods of many years. We now turn from average growth rates to focus on the deviations from average, namely the booms and the recessions.
Figure 13.1 below illustrates the booms and recessions of the U.S. economy by quarter since 1948. The average rate of growth of real GDP is 3.2% per quarter (on an annual basis), as marked by the red line, but the economy rarely grew at an average rate. In a typical recession, the growth rate might drop to −5% in some quarters, and in a boom, the economy can grow at a rate of 7 to 8% or higher. We call the fluctuations of real GDP around its long-term trend or “normal” growth rate business fluctuations or business cycles. Recessions, which we defined in Chapter 6 as significant, widespread declines in real income and employment, are shaded.
FIGURE 13.1

Note: Quarterly growth rates calculated on an annual basis. Recessions are shaded.
Business fluctuations are fluctuations in the growth rate of real GDP around its trend growth rate.
A recession is a significant, widespread decline in real income and employment.
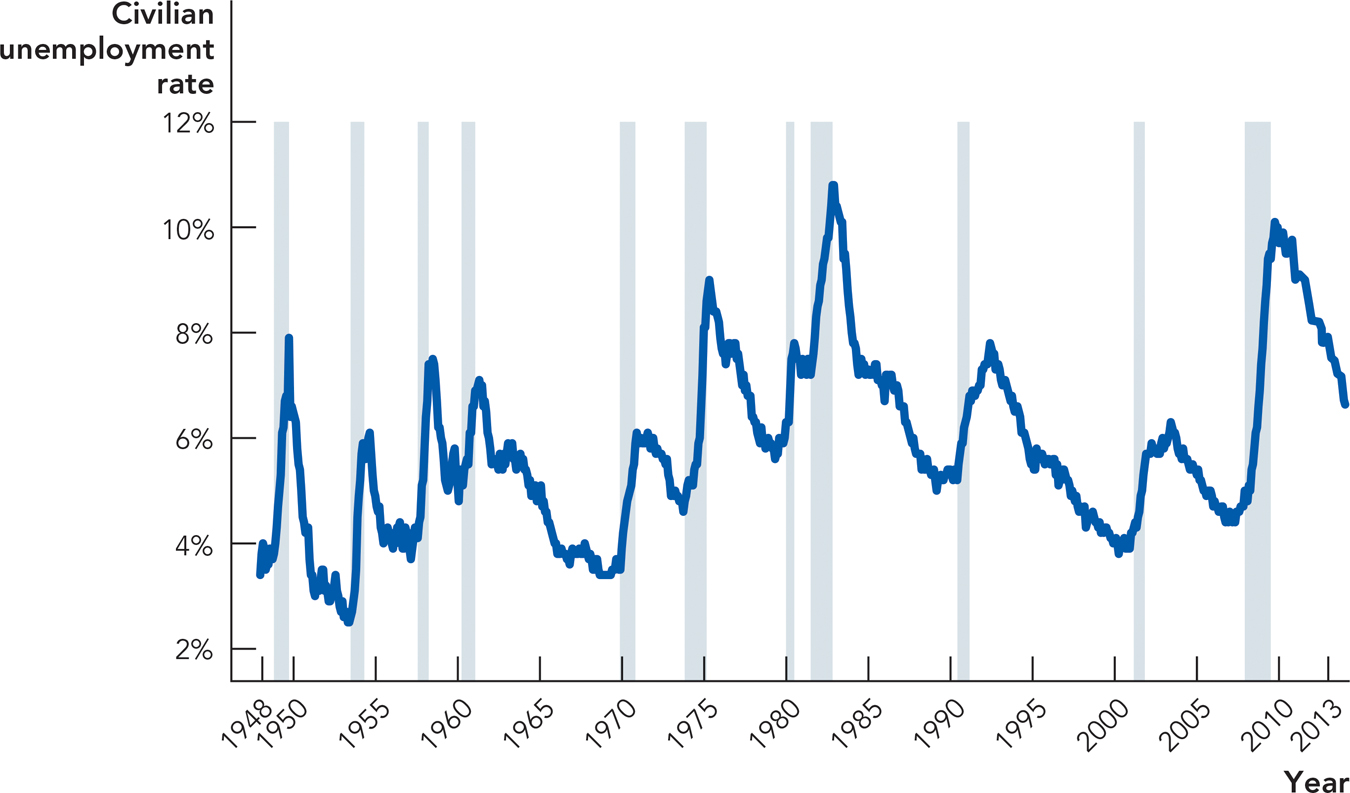
Recessions are of special concern to policymakers and the public because unemployment increases during a recession. Notice in Figure 13.2 below, for example, how unemployment increases dramatically within each of the shaded regions that are the periods of U.S. recessions.
FIGURE 13.2

Source: Bureau of Labor Statistics; National Bureau of Economic Research. Note: Recessions are shaded.
More generally, a recession is a time when all kinds of resources, not just labor but also capital and land, are not fully employed. During a recession, factories close, stores are boarded up, and farmland is left fallow. We know that some unemployment is a natural or normal consequence of economic growth—in Chapter 12, we called this level of unemployment the natural unemployment rate—but often unemployment exceeds the natural rate. More generally, when there are a lot of unemployed resources, it suggests that resources are being wasted and the economy is operating below its potential. One of the goals of economic thinking is to better understand the causes of booms and recessions, and perhaps learn how policy might help to smooth out these fluctuations. Recessions are the exception rather than the norm, but still we would all be richer and more secure if we could limit the frequency and severity of recessions.
To understand booms and recessions, we are going to develop a model of aggregate demand and aggregate supply (AD/AS). Our model will show how unexpected economic disturbances or “shocks” can temporarily increase or decrease the economy’s rate of growth. We will focus on how an economy responds to two types of shocks, real shocks (also called aggregate supply shocks) and aggregate demand shocks.
Ultimately, our AD/AS model will have three curves: the aggregate demand curve, the long-run aggregate supply curve, and the short-run aggregate supply curve. Let’s begin with the aggregate demand curve.