CHAPTER REVIEW
FACTS AND TOOLS
Question 13.12
1. Sort the following shocks into real shocks or aggregate demand shocks. Remember that “shocks” include both good and bad events.
A fall in the price of oil
A rise in consumer optimism
A hurricane that destroys factories in Florida
Good weather that creates a bumper crop of California oranges
A rise in sales taxes
Foreigners watch fewer U.S.-made movies
Fear
New inventions occur at a faster pace
A faster money growth rate
Question 13.13
2. Look at Figure 13.2. Let’s sum up some basic facts about the link between unemployment rates and recessions. Notice that the shaded bars indicate periods of recession, and wider bars mean longer recessions.
How many recessions have there been since World War II?
Since World War II, how many recessions had unemployment rates of over 10%?
Often, the unemployment rate seems to hit its peak after the recession ends: The economy goes back to growing, while the unemployment rate rises for a while. As the figure shows, the recessions of 1990 and 2001 have been clear examples of such “jobless recoveries.” Approximately how many times did the unemployment rate peak after the recession ended?
Question 13.14
3. Look at Figure 13.5. When inflation rises, does the Solow growth rate rise, fall, or remain unchanged?
Question 13.15
4. Are “real shocks” negative shocks, by definition?
Question 13.16
5. When negative real shocks hit, what typically happens to the long-run aggregate supply curve: Does it shift left, shift right, or stay in the same place?
Question 13.17
6. When negative real shocks hit, what typically happens to the aggregate demand curve? Does it shift left, shift right, or stay in the same place?
Question 13.18
7. As Figure 13.1 implies, for the United States, the long-run aggregate supply curve has, on average, been approximately 3% real growth per year. If a negative real shock hits, shifting it by 2 percentage points, what will happen to real growth: Will it be positive or negative? Would you call the resulting economic conditions a recession?
Question 13.19
8.
What does a negative real shock do to inflation: Does it rise, fall, or remain unchanged?
What does a negative real shock do to spending growth: Does it rise, fall, or remain unchanged?
What does a fall in spending growth, that is, a shift inward of the AD curve, do to real growth: Does it rise, fall, or remain unchanged?
Question 13.20
9. In the following cases, will real growth rise, fall, or remain unchanged?
Expected inflation = 5%, Actual inflation = 7%
Expected inflation = 3%, Actual inflation = 1%
Expected inflation = 6%, Actual inflation = 6%
Expected inflation = 7%, Actual inflation = -10%
Expected inflation = -1%, Actual inflation = 0%
Question 13.21
10. Consider the following figure. In this relatively unsuccessful economy, the Solow growth rate is 1% per year:
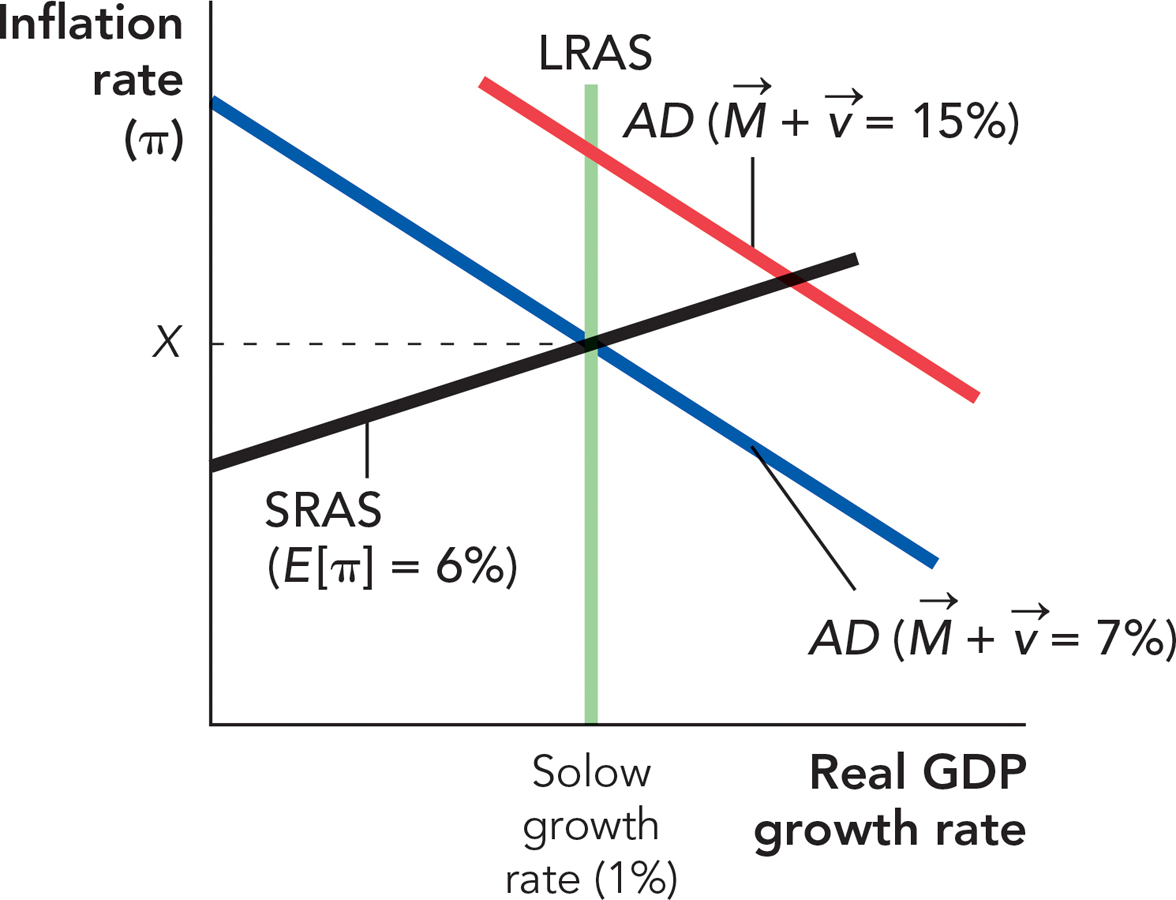
Calculate the inflation rate at X in this economy. (Hint: Use the quantity theory.)
If spending growth were 15% in this economy, what would the inflation rate be in the long run, assuming the Solow growth rate stays fixed?
Question 13.22
11.
The short-run aggregate supply (SRAS) curve is very predictable. When inflation is greater than people expect, SRAS eventually shifts (choose one: up, down) over the next year or so, and when inflation is less than people expect, SRAS eventually shifts (choose one: up, down) over the next year or so.
Here’s another, equally valid way to look at the SRAS curve: When real GDP growth is above the Solow growth rate, SRAS eventually shifts (choose one: right, left) over the next year or so, and when real GDP growth is below the Solow growth rate, SRAS eventually shifts (choose one: right, left) over the next year or so.
Explain why the two ways of looking at the SRAS curve are equivalent.
THINKING AND PROBLEM SOLVING
Question 13.23
1. Complete the following sentences:
With a real shock, when real growth is worse than usual, inflation is ________ than usual.
With an aggregate demand shock, when real growth is worse than usual, inflation is _____ than usual.
Question 13.24
2.
In the 1970s, the United States had slow growth and high inflation. Which kind of shock best fits these facts?
Negative real shock
Positive real shock
Negative aggregate demand shock
Positive aggregate demand shock
Using the same categories, explain the late 1990s, when the United States experienced fast growth and falling inflation.
Again using the same four categories, explain the early 2000s, when the United States experienced slow growth and falling inflation.
Which shock best explains the 1981-1982 recession, when inflation fell quickly and unemployment rose quickly?
Question 13.25
3. To keep things simple, let’s put this into a familiar supply and demand story and assume that in the long run, workers offer a fixed supply of labor: In other words, while they may be picky about jobs in the short run, in the long run they’ll work regardless of the going wage.
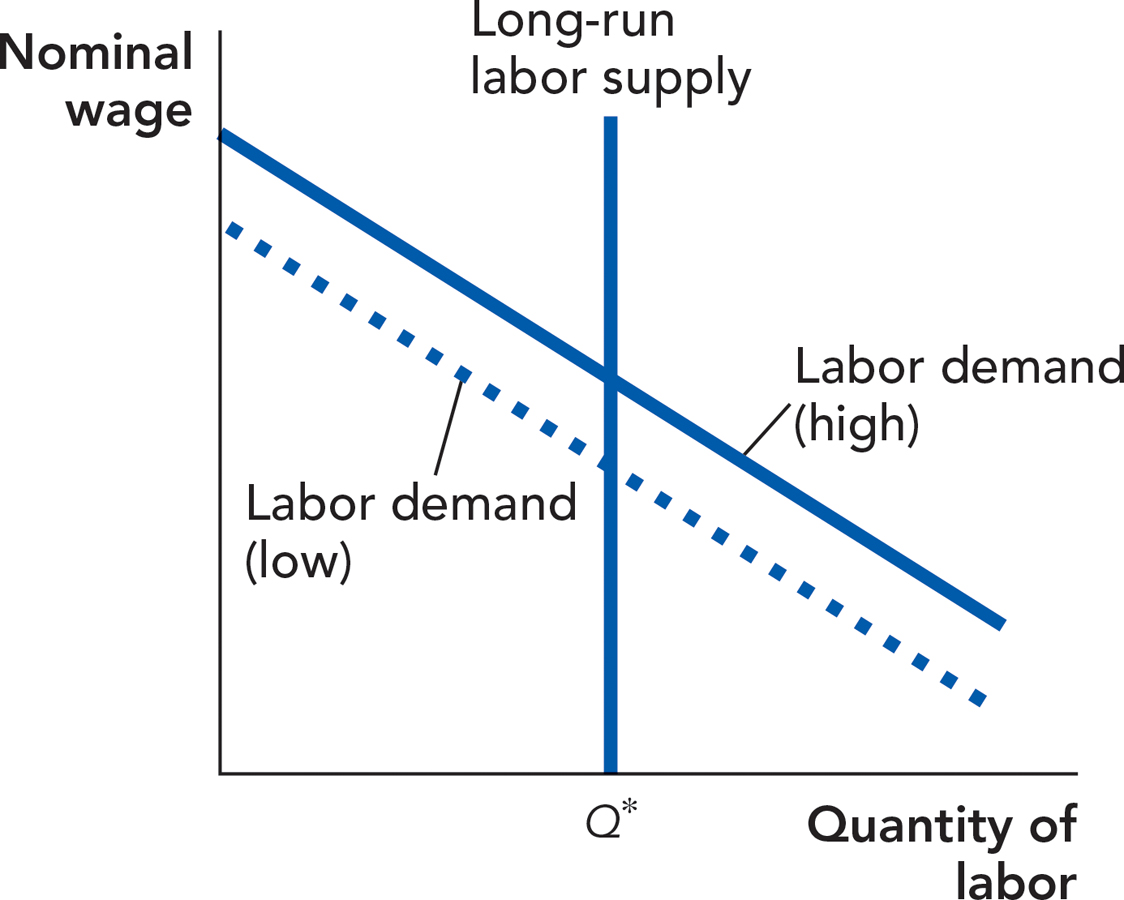
It’s the businesses who demand labor and workers who supply labor. Currently, let’s assume the economy starts off at long-run equilibrium, so that the normal number of workers, Q*, are working.
Suppose labor demand falls, shifting to the left, as in the figure. What does the short-run supply curve for labor look like if workers refuse to take pay cuts even if it means losing their jobs (we can call this the “take this job and shove it” strategy after the famous country and Western song). Indicate your answer by drawing a new line on the figure, labeling it “Short-run labor supply.” You only need to focus on the area to the left of Q.
Page 298Recalling your basic supply and demand model, does this fall in labor demand then create a “surplus” of workers or a “shortage” of workers?
According to the basic supply and demand model, what will happen to the price of labor over time as a result of this fall in labor demand?
Question 13.26
4.
If the media report a lot of good news about the economy, what is likely to happen to velocity?
If the Federal Reserve wants to keep aggregate demand (i.e., spending growth) stable, what will it do to the growth rate of the money supply when a lot of good news comes out about the economy: increase it, decrease it, or leave it unchanged? (Hint: In practice, central bankers often call this “leaning against the wind.”)
Question 13.27
5. After a monetary shock hits aggregate demand, which curve will shift to bring output growth back to the Solow growth rate: the short-run aggregate supply curve or the aggregate demand curve? (Hint: Which curve is more like a microeconomic story about prices adjusting in order to bring supply and demand into balance?)
Question 13.28
6. What happens when bad aggregate demand shocks hit the economy? Consider the following graph.
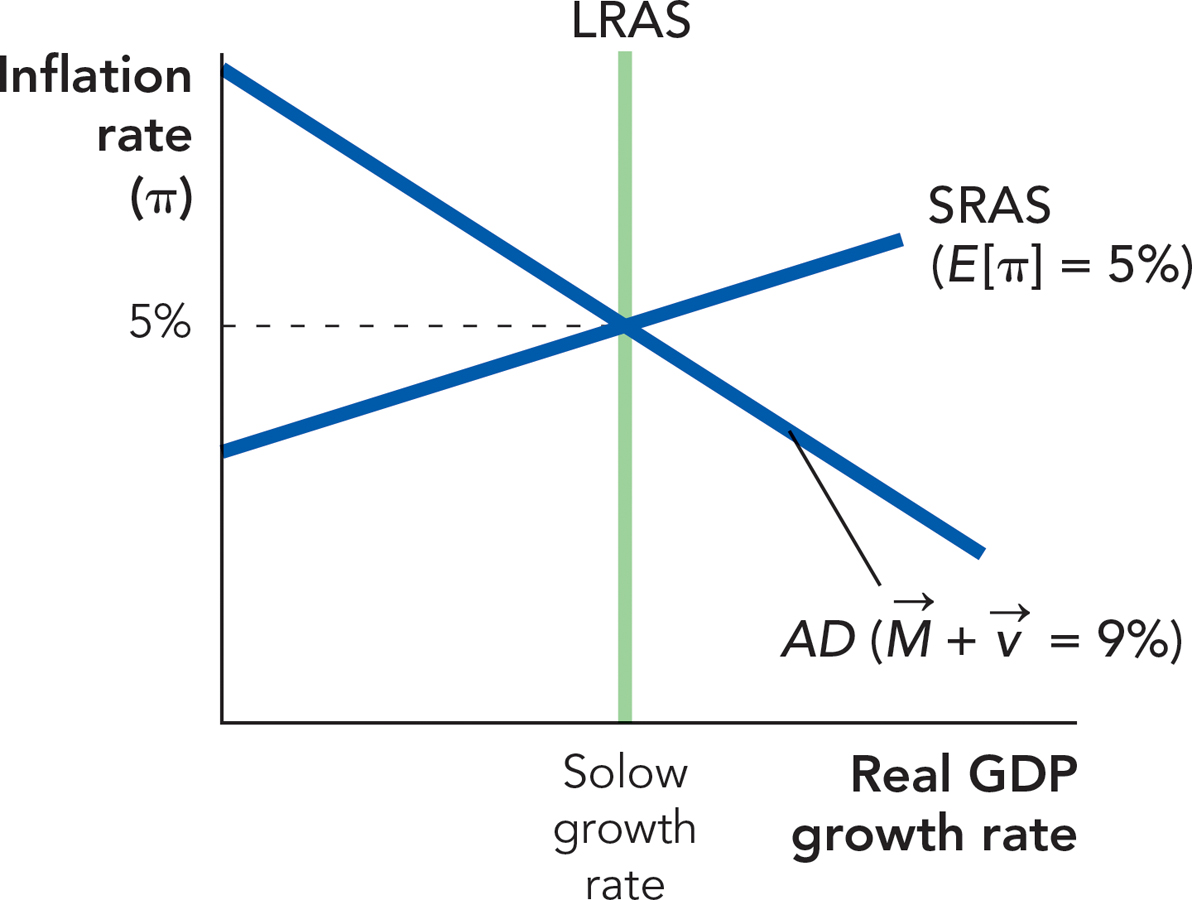
Before we get to the bad aggregate demand shock, let’s find out what the Potential growth rate is in this economy. Use the quantity theory to find your answer.
Because of a fall in the growth of the money supply, spending growth falls to 4% per year. Draw the immediate result on aggregate demand in the graph.
This fall in money growth lasts for many years. Eventually, in the long run, workers, business owners, and consumers all adjust their inflation expectations enough so that the economy returns to the Potential growth rate. Draw this new SRAS curve in the figure.
In the long run, after spending growth falls to 4% per year, what will the Potential growth rate be? What will inflation be?
Question 13.29
7. Real-world economies get hit with lots of shocks to aggregate demand and real shocks. Some shocks clearly fit into the first category, some into the second, and some include a generous mix of both. Let’s categorize the following shocks. Only one is a clear case of “both.”
Steelworkers go on strike, so less steel is produced.
Businesses read about the glories of mobile commerce, so demand for high-tech investment purchases increases.
U.S. senators read about the glories of the Internet, so demand for high-tech government purchases increases.
A series of investment banks like Lehman Brothers and Bear Stearns go bankrupt.
Around 2000, the glories of the Internet fade a bit so innovations increase at a somewhat slower rate for a few years.
The U.S. government launches two costly wars almost simultaneously, so government purchases increase dramatically (referring to World War II, of course).
The U.S. government launches two costly wars almost simultaneously, using the draft to force many men to work much longer hours and supply more labor than they would otherwise.
Question 13.30
8. Let’s have some practice with the aggregate demand curve. If you want to draw it in your familiar y = b + mx format, you can think of it this way:
Inflation = (Growth in money + Growth in velocity) − Real growth
When you look at a fixed aggregate demand curve, like the one in Figure 13.3, what is being held constant? (choose one):
Page 299Spending growth (growth in M + growth in v)
Real GDP growth (growth in Y)
Inflation (growth in P)
When you look at a shifting aggregate demand curve, like the one in Figure 13.4, what had to change to make the curve shift? (choose one):
Spending growth (growth in M + growth in v)
Real GDP growth (growth in Y)
Inflation (growth in P)
According to the quantity theory, which of the following statements must be false, and why? More than one may be false.
“Last year, spending grew at 10%, real growth was 4%, and inflation was 6%.”
“Last year, spending grew at 4%, real growth was -2%, and inflation was 6%.”
“Last year, spending grew at 100%, real growth was 0%, and inflation was 20%”
“Last year, spending grew at 5%, real growth was 5%, and inflation was 2%”
“Last year, spending grew at 10%, real growth was 5%, and inflation was -5%”
Question 13.31
9. In the aggregate demand and supply model, what is “sticky”? More than one may be true: wages, real growth, prices, velocity, money growth, unemployment.
Question 13.32
10. During the Great Depression, which of the following were mostly aggregate demand shocks and which were mostly negative real shocks?
The fall in the growth rate of money
The fall in farm productivity
The Smoot—Hawley Tariff Act
CHALLENGES
Question 13.33
1. Here is a puzzle. A country with a relatively small positive aggregate demand shock (a shift outward in the AD curve) may have a substantial economic boom, but sometimes countries that have massive increases in the AD curve (hyperinflation countries like Germany before World War II, e.g.) don’t seem to have massive economic booms. Why does a small AD increase sometimes raise GDP much more than a giant AD increase?
Question 13.34
2. Some companies raise their workers’ pay by giving raises, but others prefer to give one-time bonuses instead. Think about two steel mills facing a big two-year drop in steel demand: In one steel mill, workers have received pay raises every year for five years. In the second mill, most of the pay increases have occured through big bonuses at the end of each year. Which steel mill will probably keep more jobs during the two-year downturn? Why?
Question 13.35
3. Reconsider your answer to Facts and Tools question 3. If you wanted to draw the long-run aggregate supply curve accurately, taking into account the idea that very high rates of inflation are likely to reduce real growth, how would you draw the long-run aggregate supply curve?
Would you draw a perfectly vertical curve, a curve with a positive slope, or a curve with a negative slope?
Question 13.36
4.
If aggregate demand shocks are the most important drivers of business fluctuations, then should we expect real wages to be procyclical (rising when GDP growth is high) or countercyclical (rising when GDP growth is low)?
If real shocks are the most important drivers of business fluctuations, then should we expect real wages to be procyclical or countercyclical?
Macroeconomists find mixed evidence on the link between business fluctuations and inflation. But there’s more agreement on the link between business fluctuations and real wages: The real wage is procyclical, growing quickly during good times and growing slowly or falling during bad times. Which of the two shocks (real or aggregate demand) is this most consistent with? (We’ll revisit this question in the next chapter.)
Question 13.37
5. Often, more than one kind of shock hits the economy at once. When this happens, the different shocks could push inflation (or real growth) in different directions in the short run, leaving the final short-run result ambiguous. What is most likely to happen to inflation and real output growth in the following cases: Will they rise or fall, or can’t you tell with the information given? Note that you will often (maybe always) be able to definitely know the answer for one but not the other.
A nation’s scientists invent many new Internet search tools, raising current productivity and making investors optimistic about future inventions as well.
Page 300A government raises taxes and its economy experiences a year of excellent weather for growing crops.
Oil prices skyrocket and the central bank slows the rate of money growth.
Question 13.38
6. Use Figure 13.11 as a starting point for this problem and consider the initial impact of the following circumstances on the aggregate demand, long-run aggregate supply, and short-run aggregate supply curves.
A war in the Middle East rapidly increases the price of oil.
More and more consumers develop a fear that they are in danger of losing their jobs and businesses fear that they are in danger of losing their customers.
Add to this set of problems the uncertainty that a new administration introduces by pushing through significant social reform expected to increase business costs and reduce consumers’ discretionary income.
Question 13.39
7. Continuing from your short-run results in the previous problem, what do you believe will happen in the long run as these adjustments work their way through the economy?
Question 13.40
8. A significant productivity slowdown occurred during the 1970s and 1980s. A large part of it occurred in industries closely related to the energy crises of the 1970s. (Besides the “Oil Shocks” section in this chapter, you can read a brief summary about these developments in the NBER Digest, http://www.nber.org/digest/jun05/w10950.html.)
Use the aggregate demand and supply model to show the effects of the energy crises and productivity slowdown on the economy if spending growth remains unchanged.
Suppose that unaware of the productivity slowdown at the time, monetary authorities increased the growth rate of money in order to stimulate spending growth, or AD, and boost employment. What impact would this have on the economy?
Review Figure 13.1, Figure 13.2, and Figure 12.2 (The Inflation Rate in the United States) and determine if it seems like the scenario described in this problem might have been possible. Why?
Question 13.41
9. Following the productivity slowdown discussed in question 8, the U.S. economy experienced a relatively quick transition to the electronic age of computers and the Internet, and many of the outward effects of the 1970s energy crises faded as a result.
Use the aggregate demand and supply model to show the effects of widespread computer and Internet usage on the economy if spending growth remains unchanged.
Suppose that velocity increases due to greater consumer confidence because of your findings in part a. First, does greater consumer confidence make sense? Why?
Second, how will this affect inflation and GDP growth in the long run?
WORK IT OUT
From the equation of exchange, MV = PY, we know that spending growth  equals Inflation (π) + Real growth. Recall from the chapter that in the long run (1) the inflation rate is found where the AD curve intersects the LRAS curve (reading off the vertical axis) and (2) the expected inflation rate is found where the short-run aggregate supply curve intersects the LRAS curve. With these things in mind, assume that the Solow growth rate is 3% and answer parts a through d.
If spending growth equals 10%, what will π equal in the long run? What will Eπ equal?
If spending growth equals 6%, what will π equal in the long run? What will Eπ equal?
If spending growth equals 4%, what will π equal in the long run? What will Eπ equal?
What can we say about inflation π and expected inflation Eπ in the long run?