What Shifts the Supply Curve?
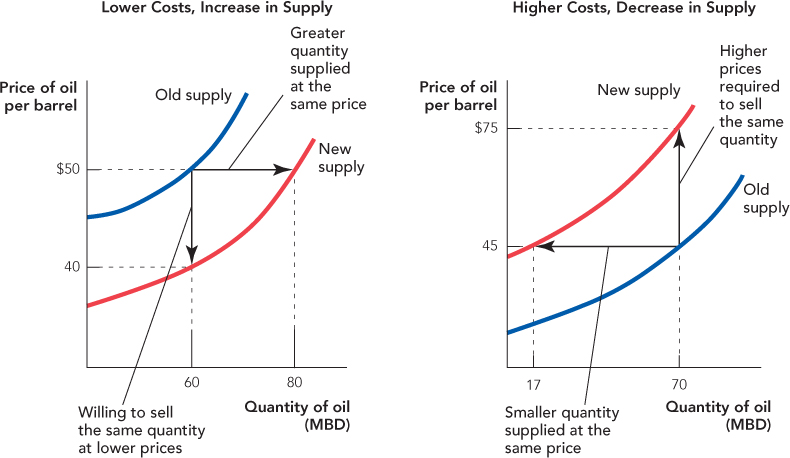
The second important concept suggested by Figure 3.9 is the connection between the supply curve and costs. What happens to the supply curve when the cost of producing oil falls? Suppose, for example, that a technological innovation in oil drilling such as sidewise drilling allows more oil to be produced at the same cost. What happens to the supply curve? The supply curve tells us how much suppliers are willing to sell at a particular price. The new technology makes some oil fields profitable that were previously unprofitable, so at any price suppliers are now willing to supply a greater quantity. Equivalently, the new technology lowers costs, so suppliers will be willing to sell any given quantity at a lower price. Either way, economists say that a decrease in costs increases supply. In terms of the diagram, a decrease in costs means that the supply curve shifts down and to the right. The left panel of Figure 3.11 illustrates. Of course, higher costs mean that the supply curve shifts in the opposite direction, up and to the left as illustrated in the right panel of Figure 3.11.
FIGURE 3.11
Once you know that a decrease in costs shifts the supply curve down and to the right and an increase in costs shifts the supply curve up and to the left, then you really know everything there is to know about supply shifts. It can take a little practice, however, to identify the many factors that can change costs. Here are some important supply shifters:
Important Supply Shifters
 Technological innovations and changes in the price of inputs
 Taxes and subsidies
 Expectations
 Entry or exit of producers
 Changes in opportunity costs
It can also help in analyzing supply shifters to know that sometimes it’s easier to think of cost changes as shifting the supply curve right or left, and other times it’s a little easier to think of cost changes as shifting the supply curve up or down. These two methods of thinking about supply shifts are equivalent and correspond to the two methods of reading a supply curve, the horizontal and vertical readings, respectively. We will give examples of each method as we exam ine some cost shifters in action.
Technological Innovations and Changes in the Price of Inputs We have already given an example of how improvements in technology can reduce costs, thus increasing supply. A reduction in input prices also reduces costs and thus has a similar effect. A fall in the wages of oil rig workers, for example, will reduce the cost of producing oil, shifting the supply curve down and to the right as in the left panel of Figure 3.11. Alternatively, an increase in the wages of oil rig workers will increase the cost of producing oil, shifting the supply curve up and to the left as in the right panel of Figure 3.11.
Taxes and Subsidies We can get some practice using up or down shifts to analyze a cost change by examining the effect of a $10 oil tax on the supply curve for oil. As far as firms are concerned, a tax on output is the same as an increase in costs. If the government taxes oil producers $10 per barrel, this is exactly the same to producers as an increase in their costs of production of $10 per barrel.
In Figure 3.12, notice that before the tax, firms require $40 per barrel to sell 60 million barrels of oil per day (point a). How much will firms require to sell the same quantity of oil when there is a tax of $10 per barrel? Correct, $50. What firms care about is the take-home price. If firms require $40 per barrel to sell 60 million barrels of oil, that’s what they require regardless of the tax. When the government takes $10 per barrel, firms must charge $50 to keep their take-home price at $40. Thus, in Figure 3.12, notice that the $10 tax shifts the supply curve up by exactly $10 at every point along the curve.
FIGURE 3.12
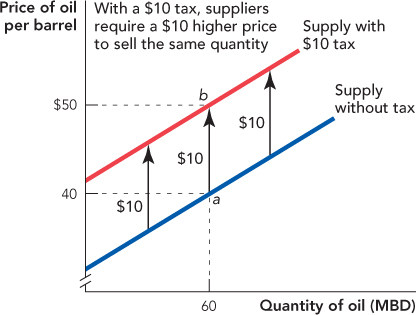
It’s important to avoid one possible confusion. All we have said so far is that a $10 tax shifts the supply curve for oil up by $10. We haven’t said anything about the effect of a tax on the price of oil—that’s because we have not yet analyzed how market prices are formed. We are saving that topic for Chapter 4.
How does a subsidy, a tax-benefit, or write-off shift the supply curve? We will save that analysis for the end-of-chapter problems but here’s a hint: A subsidy is the same as a negative or “reverse” tax.
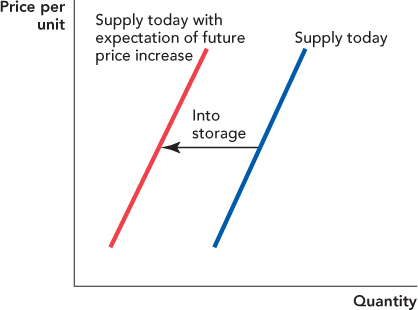
Expectations Suppliers who expect that prices will increase in the future have an incentive to sell less today so that they can store goods for future sale. Thus, the expectation of a future price increase shifts today’s supply curve to the left as illustrated in Figure 3.13. The shifting of supply in response to price expectations is the essence of speculation, the attempt to profit from future price changes.
FIGURE 3.13
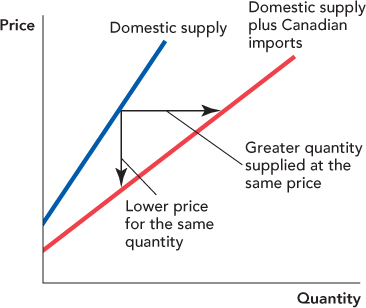
Entry or Exit of Producers When the United States signed the North American Free Trade Agreement (NAFTA), reducing barriers to trade among the United States, Mexico, and Canada, C anadian producers of lumber entered the U.S. market and increased the supply of lumber. We can most easily think about this as a shift to the right of the supply curve.
In Figure 3.14, the domestic supply curve is the supply curve for lumber before NAFTA. The curve labeled domestic supply plus Canadian imports is the supply curve for lumber after NAFTA allowed Canadian firms to sell in the United States with fewer restrictions. The entry of more firms meant that at any price a greater quantity of lumber was available; that is, the supply curve shifted to the right.*
FIGURE 3.14
In a later chapter, we discuss the effects of foreign trade at greater length.
Changes in Opportunity Costs The last important supply shifter, changes in opportunity costs, is the trickiest to understand. Recall from Chapter 1 that when the unemployment rates increase, more people tend to go to college. If you can’t get a job, you aren’t giving up many good opportunities by going to college. Thus, when the unemployment rate increases, the (opportunity) cost of college falls and so more people attend college. Notice that to understand how people behave, you must understand their opportunity costs.
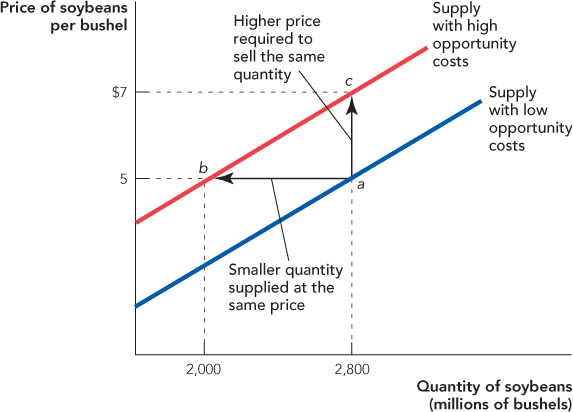
Now suppose that a farmer is currently growing soybeans but that his land could also be used to grow wheat. If the price of wheat increases, then the farmer’s opportunity cost of growing soybeans increases and the farmer will want to shift land from soybean production into the more profitable alternative of wheat production. As land is taken out of soybean production, the supply curve for soybeans shifts up and to the left.
In Figure 3.15, notice that before the increase in the price of wheat, farmers would be willing to supply 2,800 million bushels of soybeans at a price of $5 per bushel (point a). But when the price of wheat increases, farmers are willing to supply only 2,000 million bushels of soybeans at a price of $5 per bushel because an alternative use of the land (growing wheat) is now more valuable. Equivalently, before the increase in the price of wheat, farmers were willing to sell 2,800 million bushels of soybeans for $5 per bushel, but after their opportunity costs increase, farmers require $7 per bushel to sell the same quantity (point c).
FIGURE 3.15
CHECK YOURSELF
Question 3.3
 Technological innovations in chip making have driven down the costs of producing computers. What happens to the supply curve for computers? Why?
Question 3.4
 The U.S. government subsidizes making ethanol as a fuel made from corn. What effect does the subsidy have on the supply curve for ethanol?
Similarly, a decrease in opportunity costs shifts the supply curve down and to the right. If the price of wheat falls, for example, the opportunity cost of growing soybeans falls and the supply curve for soybeans will shift down and to the right. It’s just another example of a running theme throughout this chapter, namely that both supply and demand respond to incentives.