Does the Model Work? Evidence from the Laboratory
It’s easy to see the equilibrium price and quantity when we draw textbook supply and demand curves, but in a real market the demanders and sellers do not know the true curves. Moreover, the conditions required to maximize the gains from trade are quite sophisticated. So how do we know whether the model really works?
In 1956, Vernon Smith launched a revolution in economics by testing the supply and demand model in the lab. Smith’s early experiments were simple. He took a group of undergraduate students and broke them into two groups, buyers and sellers. Buyers were given a card that indicated their maximum willingness to pay. Sellers were given a card that indicated their cost, the minimum price at which they would be willing to sell. The buyers and sellers were then instructed to call out bids and offers (“I will sell for $3.00” or “I will pay $1.50”). Each student could earn a profit by the difference between their willingness to pay or sell and the contract price. For example, if you were a buyer and your card said $3.00 and you were able to make a deal with a seller to buy for $2.00, then you would have made a $1.00 profit.
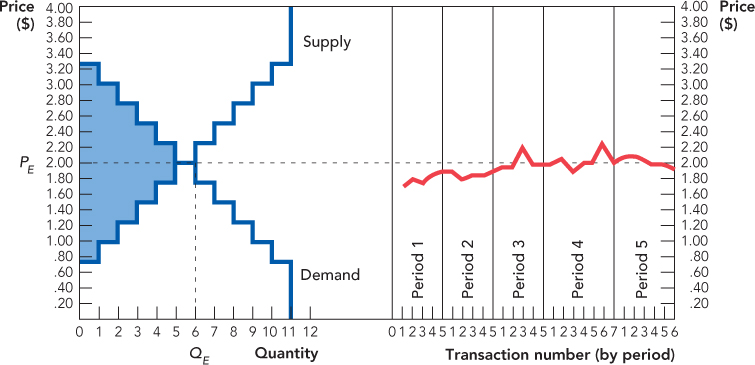
The students knew only their own willingness to pay or to sell, but Vernon Smith knew the actual shape of the supply and demand curves. Smith knew the curves because he knew exactly what cards he had handed out. Data from one of Smith’s first experiments are shown in Figure 4.5. Smith handed out 11 cards to sellers and 11 to buyers. The lowest-cost seller had costs of 75 cents, the next lowest-cost seller had costs of $1.00. Thus, at any price below 75 cents the quantity supplied on the market supply curve was zero, between 75 cents and $1, the quantity supplied was 1 unit; between $1.00 and $1.25, the next highest cost, 2 units; and so forth. Looking at the figure can you see how many units were demanders willing to buy at a price of $2.65? At a price of $2.65, the quantity demanded is 3 units. (To test yourself, identify, by their willingness to pay, exactly which three buyers are willing to buy at a price of $2.65.)
FIGURE 4.5


Smith knew from the graph that the equilibrium price and quantity as predicted by the supply and demand model were $2.00 and 6 units, respectively. But what would happen in the real world? Smith ran his experiment for 5 periods, each period about 5 minutes long. The right side of the figure shows the price for each completed trade in each period. The prices quickly converged toward the expected equilibrium price and quantity so that in the last period the average price was $2.03 and the quantity exchanged was 6 units.
Smith’s market converged rapidly to the equilibrium price and quantity exactly as predicted by the supply and demand model. But recall that the model also predicts that a free market will maximize the gains from trade. Remember our conditions for efficiency, which in this context are that the supply of goods must be bought by the demanders with the highest willingness to pay, the supply of goods must be sold by the suppliers with the lowest costs, and the quantity traded should be equal to 6 units, neither more nor less.
So what happened in Smith’s test of the market model? In the final period, 6 units were bought and sold and the buyers had the six highest valuations and the sellers the six lowest costs—exactly as predicted by the supply and demand model. Producer plus consumer surplus or total surplus was maximized. In fact, in the entire experiment only once was a seller with a cost greater than equilibrium price able to sell and only once was a buyer with a willingness to pay less than the equilibrium price able to buy—so total surplus was very close to being maximized throughout the experiment.
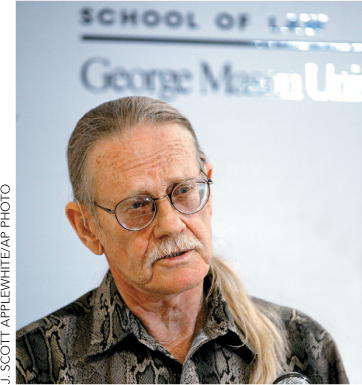
Vernon Smith began his experiments thinking that they would prove the supply and demand model was wrong. Decades later he wrote:
I am still recovering from the shock of the experimental results. The outcome was unbelievably consistent with competitive price theory…. But the results can’t be believed, I thought. It must be an accident, so I must take another class and do a new experiment with different supply and demand schedules.1
Many thousands of experiments later, the supply and demand model remains of enduring value. In 2002, Vernon Smith was awarded the Nobel Prize in Economics for establishing laboratory experiments as an important tool in economic science.