Cyclical and Short-Run Changes in GDP
A recession is a significant, widespread decline in real GDP and employment.
So far we have focused on GDP as a way to compare economic output across countries and over long periods. GDP is also used to measure short-run fluctuations in an economy, namely the ups and downs in economic growth that occur within the space of a few years. As we saw in Figure 6.3, U.S. growth rates varied considerably from 1948 to 2013. In some years, such as 2009, the growth rate was negative. Recessions—significant, widespread declines in real GDP and employment—are of special concern to policymakers and the public.
The National Bureau of Economic Research (NBER), a research organization based in Cambridge, Massachusetts, is considered the most authoritative source on identifying U.S. recessions. The official NBER definition of a recession is as follows:
A recession is a significant decline in economic activity spread across the economy, lasting more than a few months, normally visible in real GDP, real income, employment, industrial production, and wholesale—retail sales.
A few points in this definition are worth emphasizing. A recession is widespread not only geographically but also across different sectors of the economy. Although a decline in real GDP is the single best indicator of a recession, declines will usually also be observed in income, employment, sales, and other measures of the health of an economy.
Economic data take time to collect and evaluate. In April 1991, the NBER announced that a recession had started in July 1990. In 1992, the NBER announced that the recession had ended in March 1991, a few weeks before the recession was first recognized!
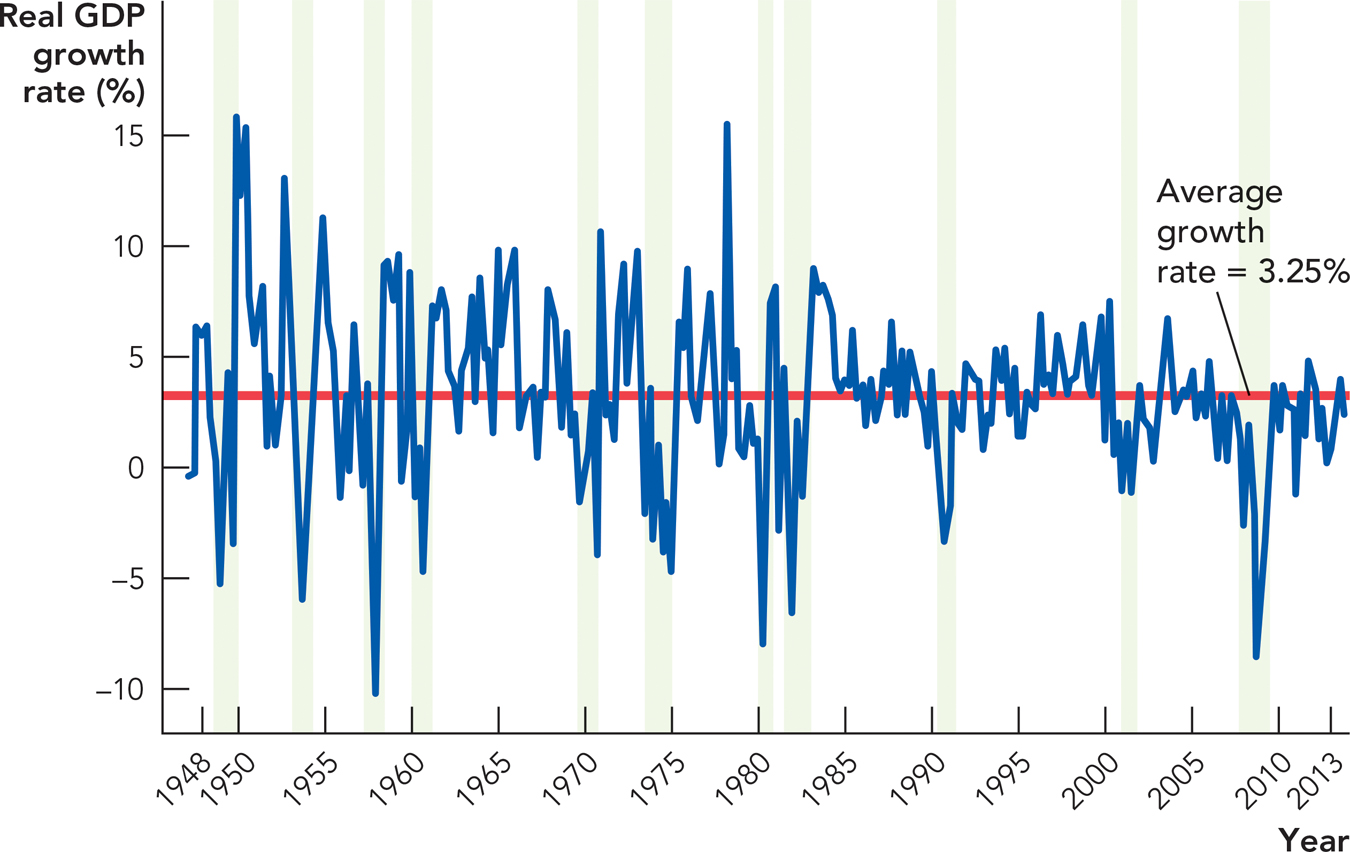
How often do recessions occur? Figure 6.5 plots real GDP growth and official U.S. recessions since 1948—this time using quarterly data (expressed as annualized rates) so we can better see the variability over time. There have been 11 recessions since 1948, indicated by the shaded bars. Notice that in addition to recessions, the figure illustrates expansions or booms when real GDP grows at a faster rate than normal. We call the fluctuations of real GDP around its long-term trend, or “normal” growth rate, business fluctuations or business cycles.
FIGURE 6.5

Source: Bureau of Economic Analysis.
Business fluctuations or business cycles are the short-run movements in real GDP around its long-term trend.
Defining when a recession begins and ends is not always obvious, in part because economic data are often revised over time. The estimate of quarterly GDP, for example, is not ready for release until almost a month after the quarter is over. After that, additional rounds of updated estimates are published in the following two months. The government often makes significant changes in GDP estimates between the original estimate and the final estimate. For example, in 2011 the BEA revised GDP estimates from 2008, and the recession in that year turned out to be even worse than earlier estimates had suggested. The BEA initially estimated that GDP had fallen at an annualized rate of -6.8% in the fourth quarter of 2008. In the revisions, the decline was significantly steeper, -8.9%. Since updates can occur years after the first estimates are released, the usefulness of GDP as a timely indicator is dampened and our understanding of recessions can change over time.
CHECK YOURSELF
Question 6.8
 What are business fluctuations?
Question 6.9
 Why is it sometimes difficult to determine if an economy is in a recession?
As another example, there is debate about when the 2001 recession started. The official NBER starting date is March 2001, but data revisions have led many people to conclude that the recession actually started in late 2000. Why all the fuss about the timing? If you recall, the presidency changed at the beginning of 2001. Democrats would like to claim that the recession was caused by Republican economic policies, while Republicans want to show that the recession began during President Clinton’s final term, before President Bush assumed office.