Key Facts about the Wealth of Nations and Economic Growth
Let’s begin with some important facts about the wealth of nations and economic growth.
Fact One: GDP per Capita Varies Enormously among Nations
SEARCH ENGINE
You can find lots of colorful data about the wealth of nations at http://www.gapminder.org/ or http://data.worldbank.org/.
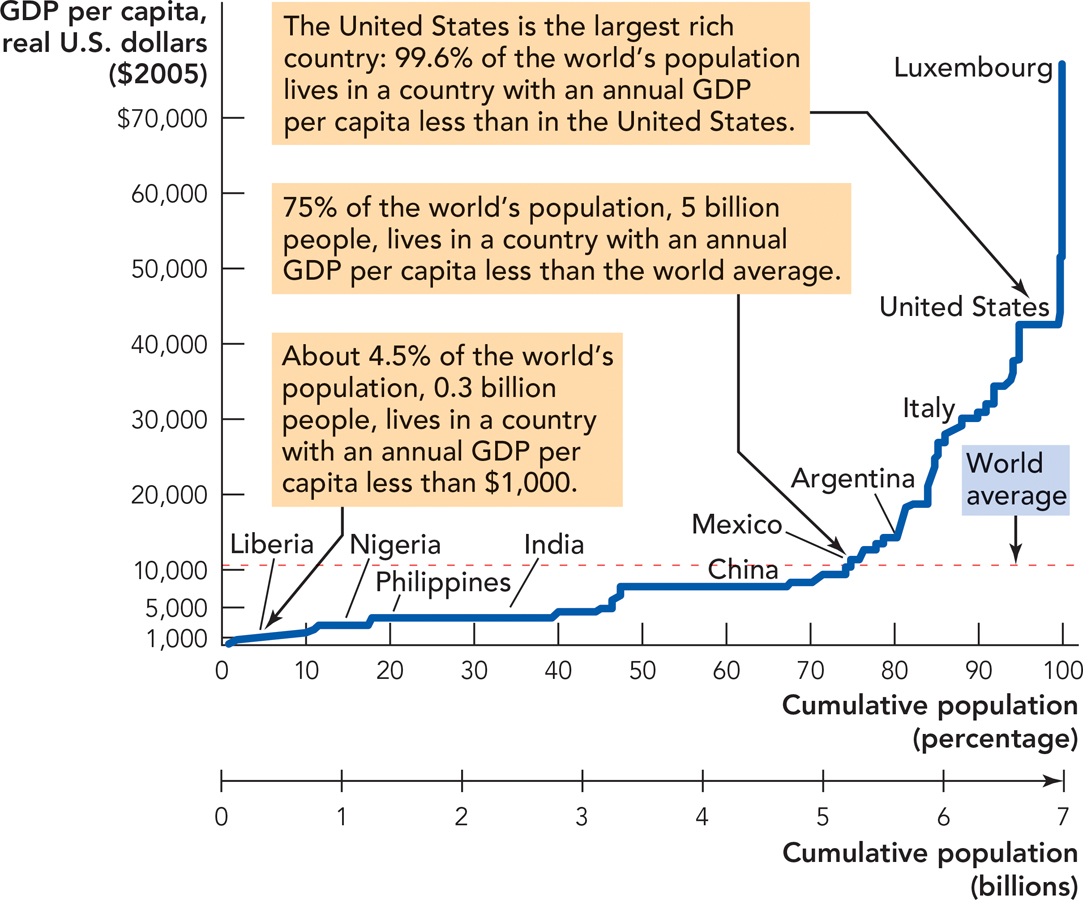
We already have some understanding of the enormous differences that exist in the wealth of nations and how these differences affect infant mortality and other measures of well-being. Figure 7.2 shows in more detail how GDP per capita differed around the world at the turn of the twenty-first century. To construct this figure, we start on the left with the world’s poorest country, which happens to be the Democratic Republic of the Congo (DRC). The DRC (not labeled) accounts for just over 1% of the world’s population. As we add successively richer countries and their populations, we move further to the right in population and upward in GDP per capita. The graph tells us, for example, that about 10% of the world’s population—or 669 million billion people in 2011—lived in a country with a GDP per capita of less than $1,500—about the level in Bangladesh. Moving farther to the right, we see that about 67% of the world’s population lived in a country with a GDP per capita equal to or less than $7,826, about the level in China. The red horizontal dashed line shows the world’s average level of GDP per capita in 2011, $10,515, which is about the same as that of Mexico. Fully 75% of the world’s population—or 5 billion people—lived in a country with a GDP per capita less than average. In other words, most of the world’s population is poor relative to the United States.
FIGURE 7.2

Source: Penn World Tables, 8.0. PPP adjusted.
In thinking about poverty, remember that GDP per capita is simply an average, and there is a distribution of income within each country. In India, GDP per capita was around $3,500, but many Indians have yearly incomes that are less than $3,500 and some have yearly incomes that are higher than the average income in the United States. Around the world, about a billion people have incomes of less than $2 per day.
Fact Two: Everyone Used to Be Poor
The distribution of world income tells us that poverty is normal. It’s wealth that is unusual. Poverty is even more normal when we think about human history. What was GDP per capita like in the year 1? No one knows for sure, but a good guesstimate is around $700—$1,000 per year in 2010 dollars, not much different from the very poorest people living in the world today. What’s surprising is not that people in the past were poor, but that everyone in the past was poor.
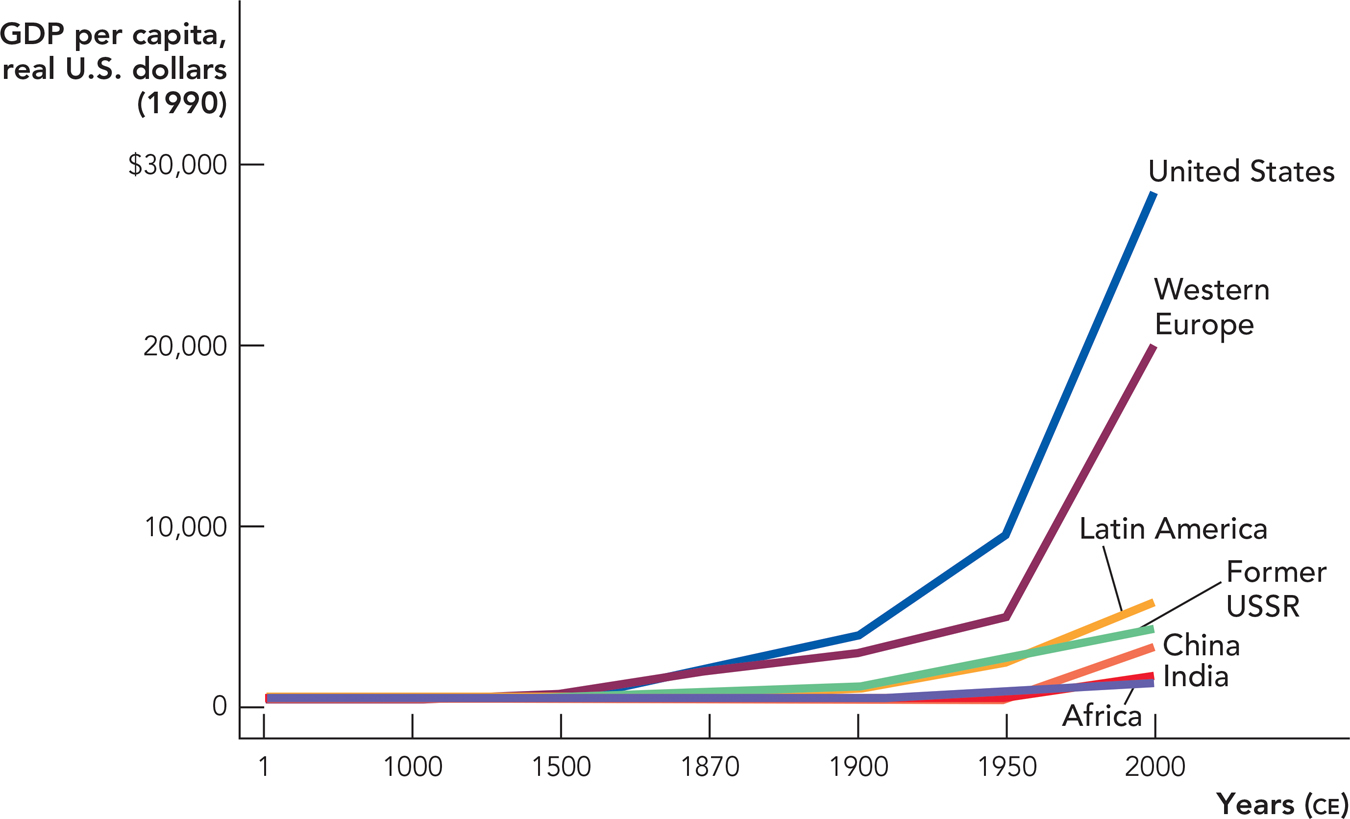
Figure 7.3 shows some estimates of GDP per capita in different regions of the world in different periods from the year 1 to 2000 ce. In the year 1, GDP per capita was about $700—$1,000 and this was approximately the same in all the major regions of the world. Today, GDP per capita is more than 50 times as large in the richest countries as in the poorest countries.
FIGURE 7.3

Source: Maddison, Angus. 2007. Contours of the World Economy: 1-2030 AD. Oxford: Oxford University Press.
Note: Timeline is not to scale.
Figure 7.3 illustrates something else of interest: GDP per capita was about the same in year 1 as it would be 1,000 years later and indeed about the same as it had been 1,000 years earlier. For most of recorded human history, there was no long-run growth in real per capita GDP. Countries might grow in particular good years, but soon enough a disaster would ensue and the gains would be given back. Only beginning in the nineteenth century does it become clear that some parts of the world began to grow at a rate unprecedented in human history.
Figure 7.3 tells us that economic growth is unusual. But once economic growth begins, it can make some parts of the world rich, while other parts languish at levels of per capita GDP similar to that in the Dark Ages. To see more clearly how small changes in economic growth can have enormous effects on GDP per capita, we pause for a primer on economic growth rates.
Economic growth is the growth rate of real GDP per capita:

where Yt is real per capita GDP in period t.
A Primer on Growth Rates Recall from Chapter 6 on GDP that a growth rate is the percentage change in a variable over a given period such as a year. When we refer to economic growth, we mean the growth rate of real per capita GDP.
While computing growth rates is simple math, grasping the impact of growth rates on economic progress is critical. Keep in mind that even slow growth, if sustained over many years, produces large differences in real GDP per capita.
To appreciate the power of economic growth, let’s consider a few cases. Suppose that the annual growth rate of real GDP per capita is 2%. How long will it take for real per capita GDP to double from $40,000 to $80,000? An average person on the street might answer, “It will take 50 years to double your income at a 2% growth rate.” But that is wrong because growth builds on top of growth. This is called “compounding” or “exponential growth.”
There is a simple approximation, called the rule of 70, for determining the length of time necessary for a growing variable to double:
Rule of 70: If the annual growth rate of a variable is x%, then the doubling time is  years.
Table 7.1 illustrates the rule of 70 by showing how long it takes for GDP per capita to double given different growth rates. At a growth rate of 1%, GDP per capita will double approximately every 70 years (70/1 = 70). If growth increases to 2%, GDP per capita will double every 35 years (70/2 = 35). Consider the impact of a 7% growth rate. If this growth can be sustained, then GDP per capita doubles every 10 years! China has been growing at this rate or a bit higher for several decades, which explains why China has become much richer in the past 30 years. China, however, is still a relatively poor country so this also tells you how very, very poor they were in the recent past.
TABLE 7.1 Years to Double Using the Rule of 70
|
Annual Growth Rate, % |
Years to Double |
|---|---|
|
0 |
Never |
|
1 |
70 |
|
2 |
35 |
|
3 |
23.3 |
|
7 |
10 |
The rule of 70 is just a mathematical approximation, but it bears out the key concept that small differences in growth rates have large effects on economic progress. See the appendix to this chapter for a discussion of how you can use Excel to understand the magic of compounding.
Another way of seeing how small changes in the rate of economic growth can lead to big effects is to think about how rich people will be in the future. U.S. per capita GDP is about $50,000 (as of 2014). How many years will it take for real per capita GDP to increase to $1 million? If growth is 2% per year, which would be a little low by U.S. standards, average income will be $1 million per year in just 150 years. If GDP per capita grows at 3% per year, which is a little high by U.S. standards but certainly not impossible, then in just 100 years the average income will be approximately $1 million per year. You and I are unlikely to see this future, but if our grandchildren are lucky, they will see a world in which U.S. GDP per capita is a million dollars, more than 22 times higher than it is today.
Fact Three: There Are Growth Miracles and Growth Disasters
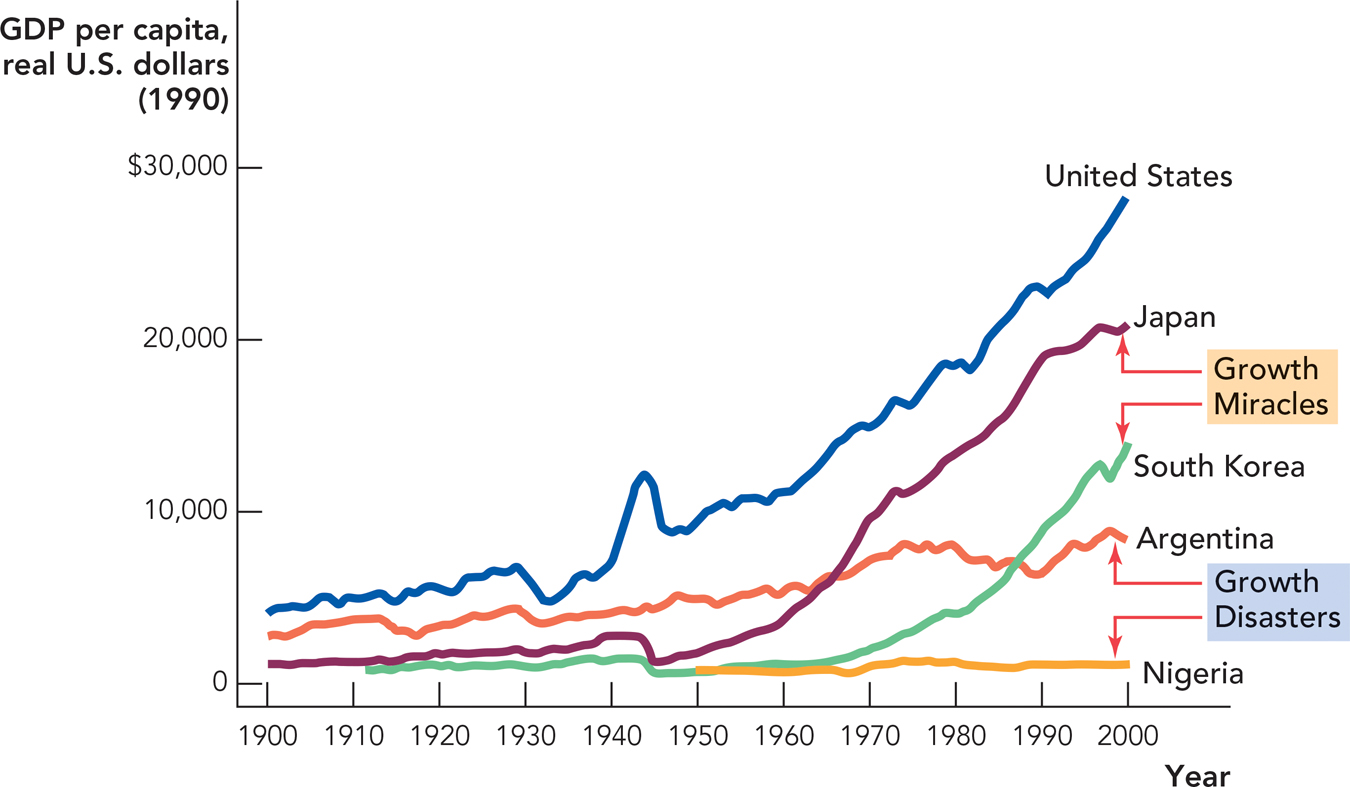
The United States is one of the wealthiest countries in the world because the United States has grown slowly but relatively consistently for more than 200 years. Can other countries catch up to the United States, and if so, will it take 200 years? Fortunately, other countries can catch up, and amazingly quickly. Figure 7.4 shows two “growth miracles.” Following World War II, Japan was one of the poorest countries in the world with a per capita GDP less than that of Mexico. From 1950 to 1970, however, Japan grew at an astonishing rate of 8.5% per year. Remember, at that rate, GDP per capita doubles in approximately 8 years (70/8.5 = 8.2)! Today, Japan is one of the richest countries in the world.
FIGURE 7.4

Source: Maddison, Angus. 2007. Contours of the World Economy: 1-2030 AD. Oxford: Oxford University Press.
In 1950, South Korea was even poorer than Japan with a GDP per capita about the same as that of Nigeria. South Korea’s growth miracle began a little later than Japan’s, but between 1970 and 1990, South Korea grew at a rate of 7.2% per year. Today, South Korea is a thriving, modern economy on par with many European economies.
Growth miracles are possible but so are growth disasters. Nigeria has barely grown since 1950 and was poorer in 2005 than in 1974 when high oil prices briefly bumped up its per capita GDP. More surprising is the case of Argentina. In 1900, Argentina was one of the richest countries in the world with a per capita GDP almost as large (75%) as that of the United States. By 1950, Argentina’s per capita GDP had fallen to half that in the United States. In 1950, however, Argentina was still a relatively wealthy country with a per capita GDP more than twice as high as that of Japan and more than five times as high as that of South Korea. Argentina failed to grow much, however, and by 2000 Argentina’s per capita GDP was less than one-third of that of the United States; Japan and South Korea are now much wealthier than Argentina.
The gap between Argentina and many other countries is continuing to grow. China (not pictured) began its own growth miracle in the late 1970s. China is still a very poor nation with a per capita GDP that in 2011 is a l ittle more than half that of Argentina. But China is growing rapidly—remember, if China continues to grow at 7% or 8% per year, it will double its income in about 10 years. Even if Argentina grows modestly, China could pass Argentina in per capita GDP in less than 20 years.
Summarizing the Facts: Good and Bad News
The facts presented above imply both good and bad news. The bad news is that most of the world is poor and more than 1 billion people live on incomes of less than $2 per day. These people have greatly reduced prospects for health, happiness, and peace. The bad news, however, is old news. For most of human history, people were poor and there was no economic growth.
CHECK YOURSELF
Question 7.1
 According to Figure 7.2, approximately what percentage of the world’s population lived in China in 2011?
Question 7.2
 If you earn 5% on your savings in a bank account, how many years will it take for your savings to double? How about if you make 8%?
Question 7.3
 In Figure 7.4, approximately when did Japan’s real GDP per capita cross the $10,000 barrier? The $20,000 barrier? What was Japan’s growth rate in that time span?
The good news is this: Despite being a relatively recent phenomenon, economic growth has quickly transformed the world. It has raised the standard of living of most people in developed nations many times above the historical norm. Even though economic growth has yet to reach all of the world, there appears to be no reason why, in principle, economic growth cannot occur everywhere. Indeed, growth miracles tell us that it doesn’t take 250 years to reach the level of wealth of the United States—South Korea was as poor as Nigeria in 1950, but today has a per capita GDP not far behind Germany or the United Kingdom.
Progress, however, is not guaranteed. The growth disasters tell us that economic growth is not automatic. Some countries such as Nigeria show few signs that they have started along the growth path, while other countries such as Argentina seem to have fallen off the growth path.
Growth miracles and disasters, however, are not purely random events over which people have no control. Inquiring into the nature and causes of the wealth of nations is critical if we are to raise the standard of living and better the human condition.
