CHAPTER 8 APPENDIXExcellent Growth
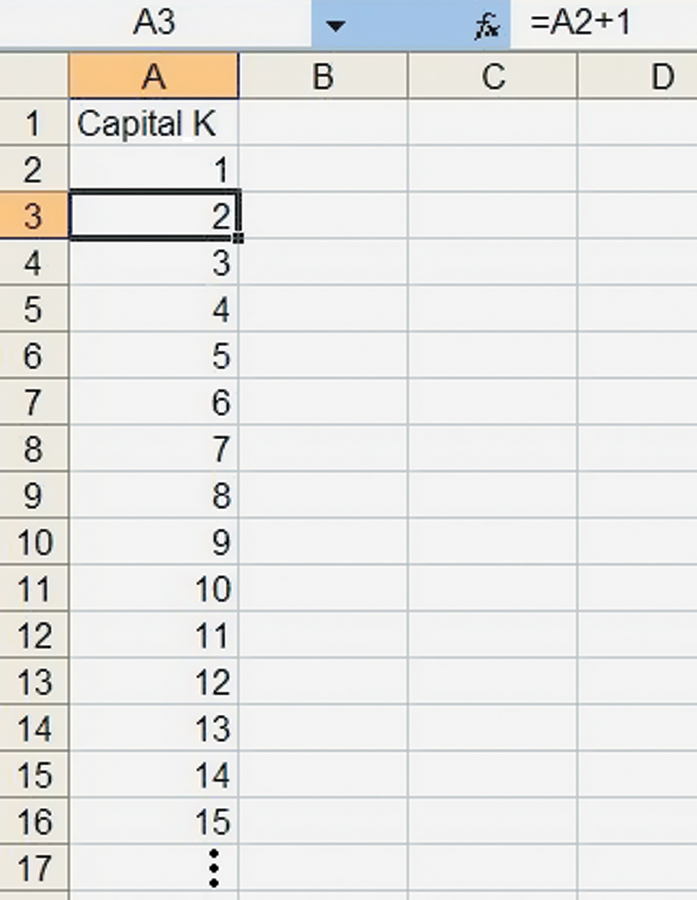
Using a spreadsheet, you can easily explore the Solow model and duplicate all the graphs in this chapter. First, label column A “Capital K” and put a 1 in cell A2. Second, you can create an increasing series by inputting the formula “=A2+1” in cell A3 and copying and pasting that formula into cells A4 to, say, A500. Your spreadsheet should look like Figure A8.1.
FIGURE A8.1
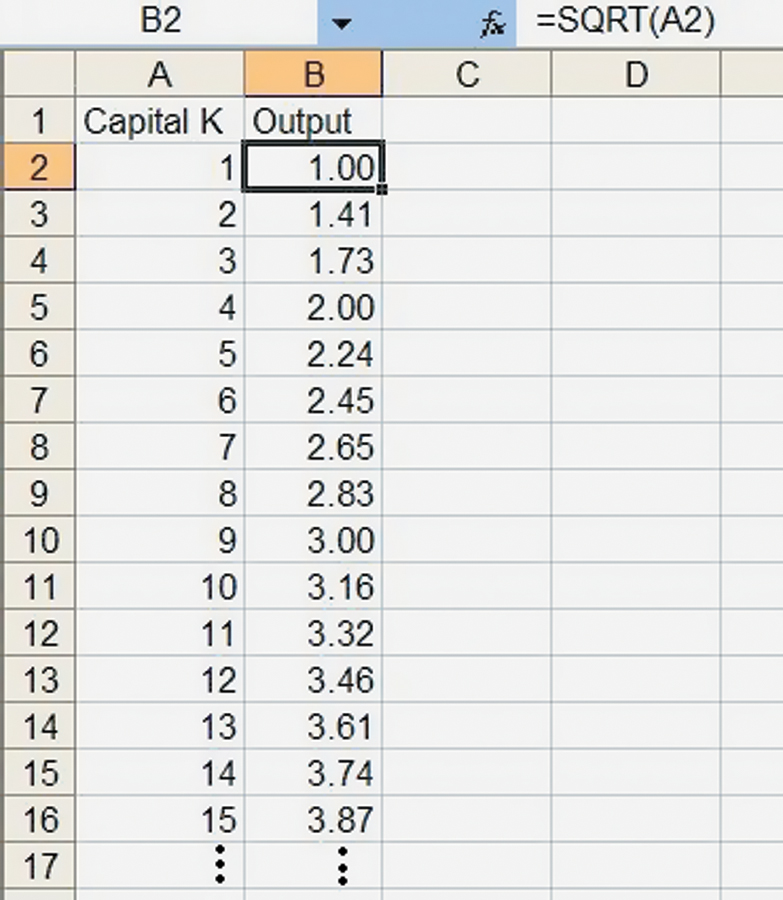
In column B, create a series for Output. Remember that  so in cell B2, input the formula “=SQRT(A2)” and then copy and paste that formula into B3 to B500, as in Figure A8.2.
FIGURE A8.2
Now create the headings Investment, Depreciation, Investment Share, and Depreciation Rate in columns C to F, as in Figure A8.3.
FIGURE A8.3
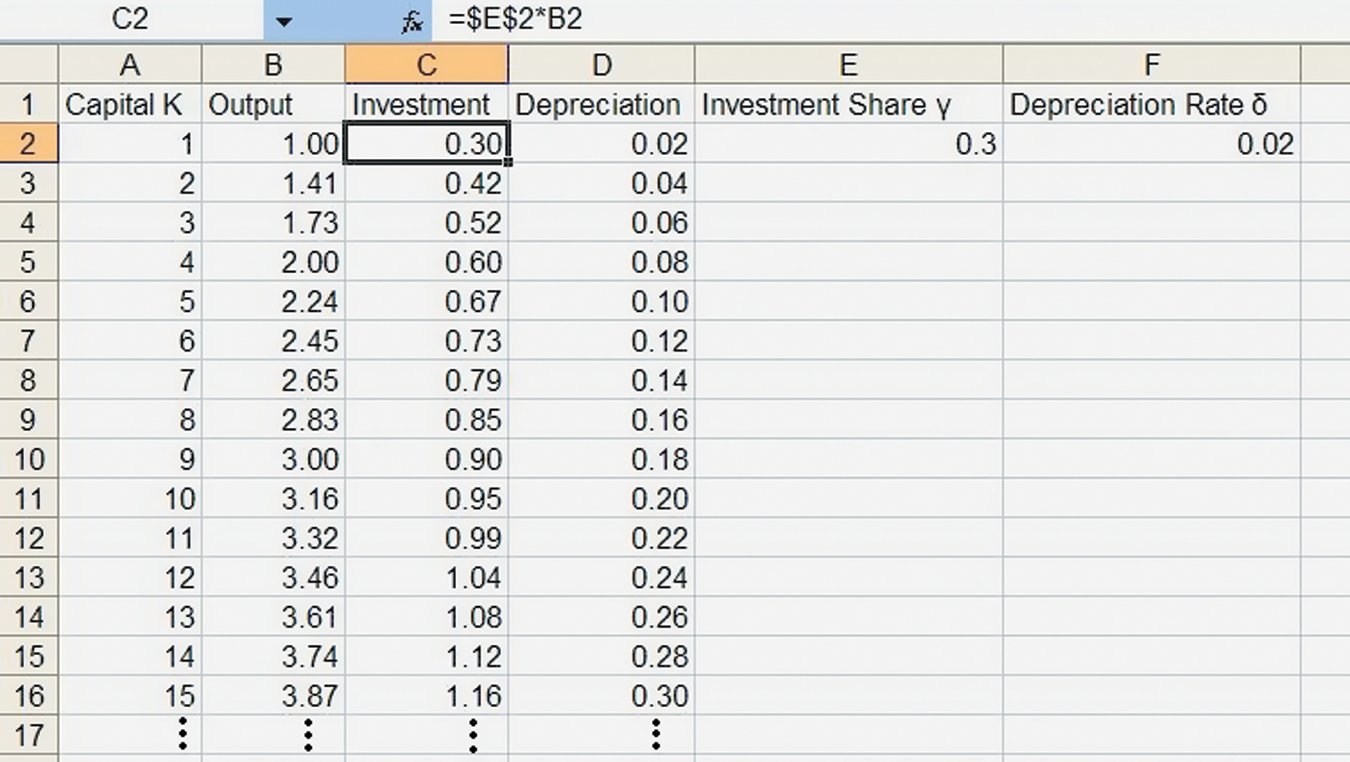
In cell E2, put the investment share, 0.3, used in the text, and in cell F2, put the rate of depreciation that we used, 0.02.
In cell C2, which is highlighted, we want to input the formula for investment, which is γY where γ is the investment share. We could input “=0.3xB2” into C2 but we would like to be able to easily adjust the investment share and see what happens, so we will input “=$E$2xB2”. The $E$2 says take the investment share from cell E2, and when we copy and paste this formula, it always uses cell E2 (not E3, E4, etc.). Copy and paste cell C2 into C3 to C500.
Depreciation is just δK where δ is the depreciation rate. As with investment, we might want to alter this parameter so into cell D2 we will input “=$F$2xA2”.
That’s it! To duplicate the graph in Figure 8.4, for example, just highlight columns A, B, C, and D, click the Chart icon (you can also click Chart in the Insert menu), choose XY (Scatter) and the highlighted subtype, and then click on finish. (In Excel 2007 click Insert and then Scatter in the Chart submenu to do the same thing.) See Figure A8.4.
FIGURE A8.4
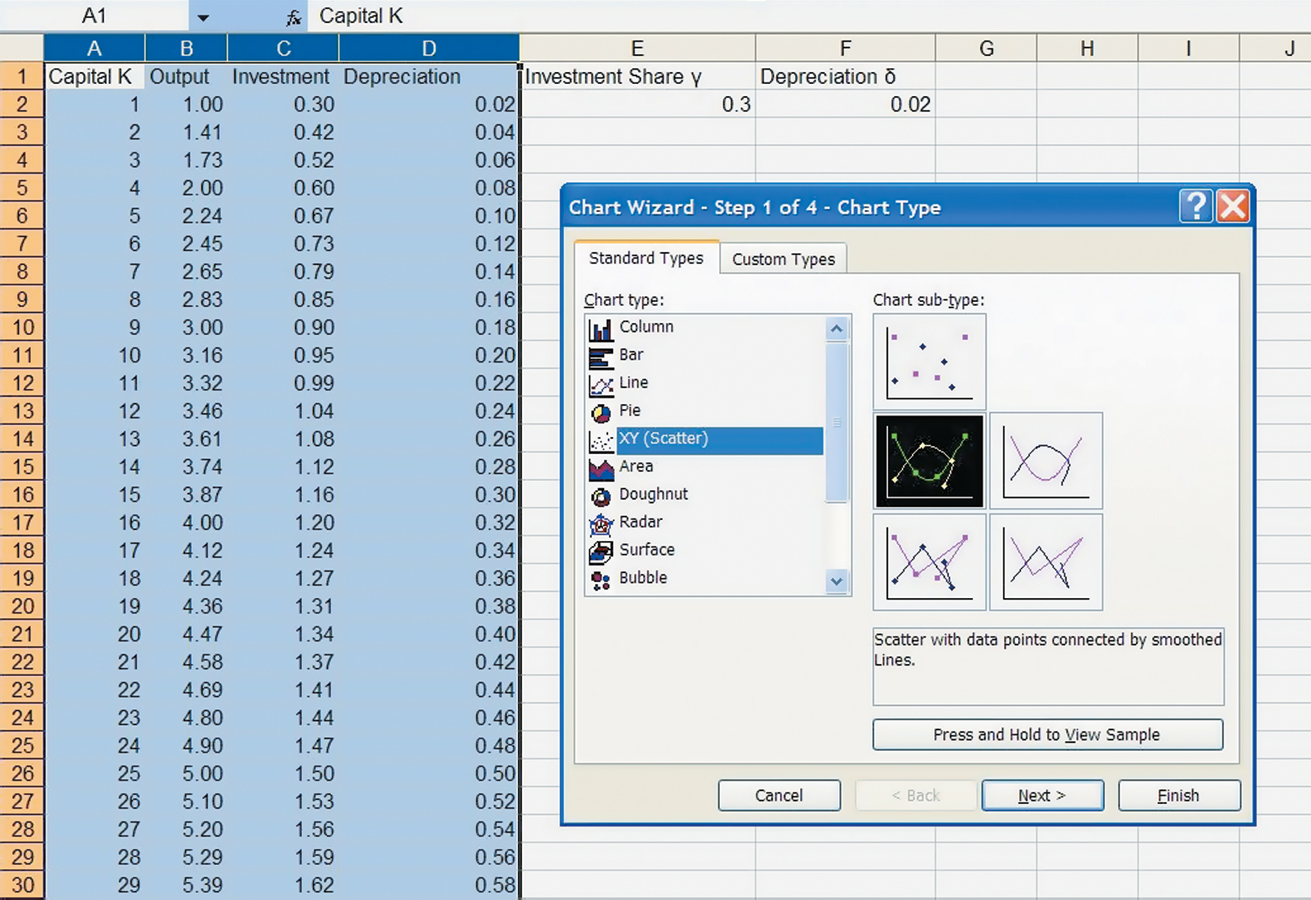
The result is as in Figure A8.5
FIGURE A8.5
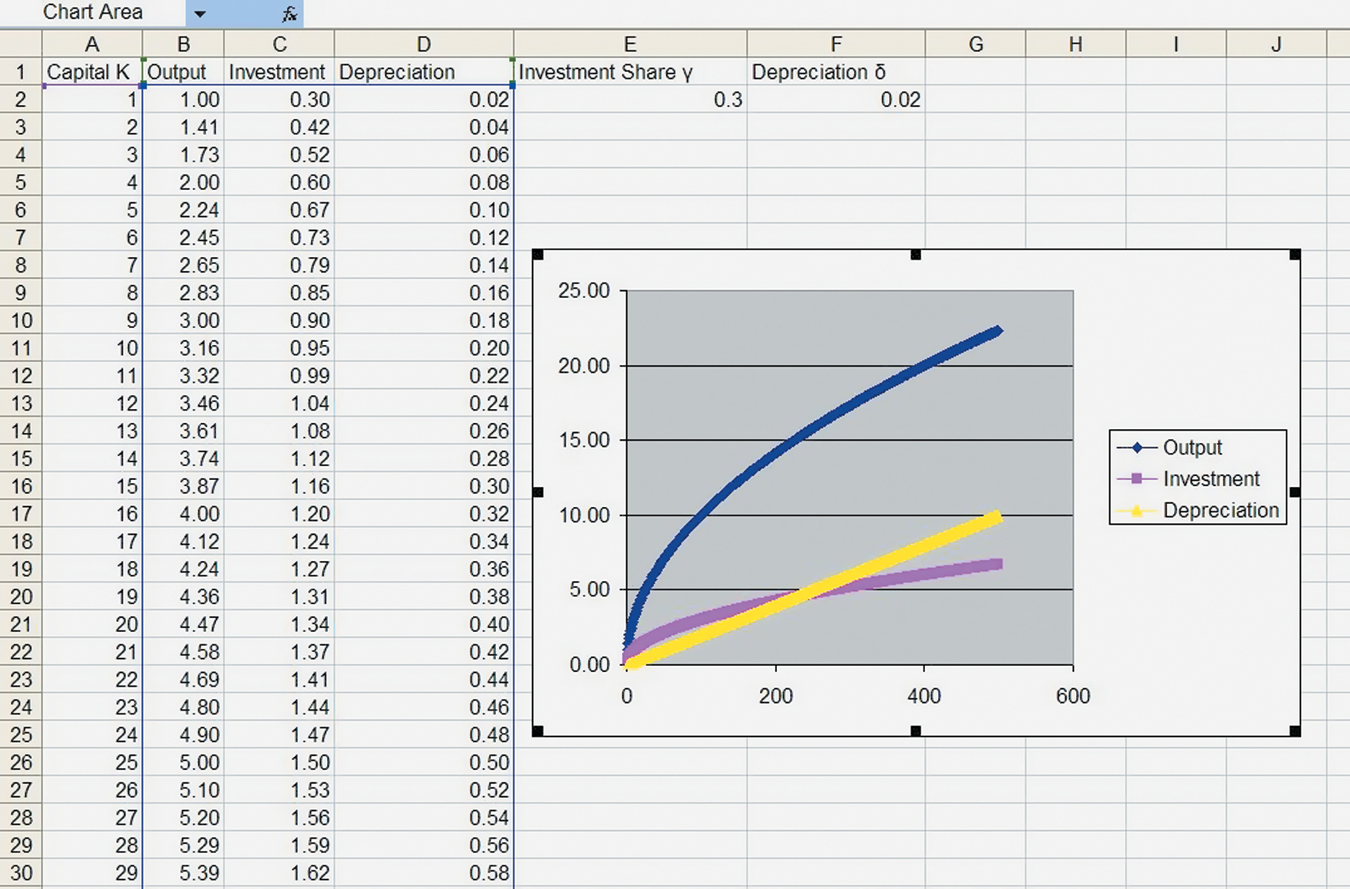
If you want to see what happens if the investment share increases to 0.4, as in Figure 8.7 in the chapter, just change cell E2 to 0.4 and the graph will change automatically. You can make other adjustments as well. One thing to watch for is that with parameters too different from the ones we have given, the equilibrium capital stock may be greater than 500. So if you want to see the full picture, you will need to extend the rows even further.