The Solow Model and Catching-Up Growth
Let’s begin with a model of the wealth of nations and economic growth called the Solow model (after Nobel Prize-winning economist Robert Solow). The Solow model begins with a production function. A production function expresses a relationship between output and the factors of production, namely the exact way in which more inputs will produce more outputs. For simplicity, we assume that there is only one output Y, which we can think of as GDP, and the three factors of production that we discussed in the last chapter: physical capital written K; human capital, which we write as eL, and can understand as education, e, times labor, L; and ideas that increase the productivity of capital and labor, which we write as A. Thus, we can write that output Y is a function F of the inputs A, K, and eL:
Y = F(A, K, eL)
That looks abstract but it represents a simple economic truth. If we look at a typical production process, say, an automobile factory, output depends on capital (the machines K ), labor (the workers L adjusted for their level of skill, so eL), and the whole factory is based on ideas (A), namely the invention of the auto and all the machines that help make it.
We also can think of the entire economy as relying on capital, labor, and ideas on a larger scale. We will focus on the Solow production function as a description of an entire economy because we are looking at the causes and consequences of overall economic growth.
For our first look at the Solow model, we will temporarily ignore changes in ideas, education, and labor. If we assume that A, e, and L are constant, then we can simplify our expression for output as Y = F(K). Notice that because L is constant, an increase in K always implies an increase in the amount of capital per worker, K/L, and an increase in Y is also always an increase in output per worker, Y/L.
Capital, Production, and Diminishing Returns
Let’s make a quick sketch of what our production function F(K) should look like. More K should produce more Y but at a diminishing rate. On a farm, for example, the first tractor is very productive. The second tractor is still useful, but not as much as the first tractor. The third tractor is driven only when one of the other tractors breaks down (remember that the amount of labor is constant). What this means is that increases in capital, K, produce less output, Y, the more K you already have—so we should have a production function where output increases with more K but at a decreasing rate. Following this logic, Figure 8.1 graphs output, Y, on the vertical axis against capital, K, on the horizontal axis, holding Land the other inputs constant.
FIGURE 8.1
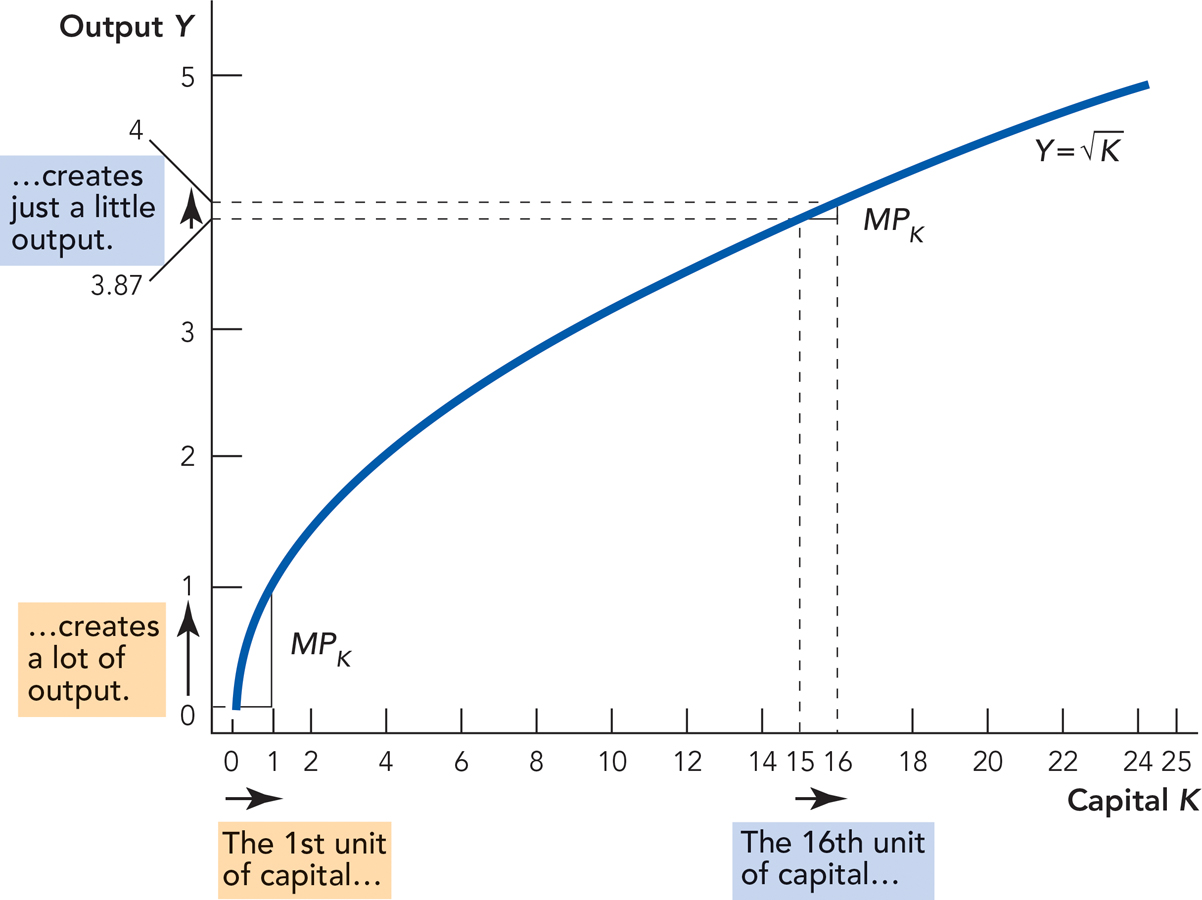
The marginal product of capital is the increase in output caused by the addition of one more unit of capital. The marginal product of capital diminishes as more and more capital is added.
Notice from Figure 8.1 that the first unit of capital increases output by one unit, but as more and more capital is added, output increases by less and less—this is the “iron logic” of diminishing returns and it plays a key role in the Solow model. Economists call the increase in output when capital increases by one unit the marginal product of capital. The graph shows that the marginal product of capital is diminishing.
It can sometimes help to look at a specific production function. In Figure 8.1, we used the production function  , which means that output is the square root of the capital input. To see how this works, plug in some numbers. If K = 4, then
  . If K increases to 16, then
  and so forth.
As we said, the reason the marginal product of capital diminishes is that the first unit of capital (the first tractor) is applied where it is most productive, the second unit is applied to slightly less productive tasks because the first unit is already performing the most productive tasks, the third unit is applied to even less productive tasks, and so on.
Growth in China and the United States The iron logic of diminishing returns explains quite a bit about why China is now growing so much more rapidly than the United States. Imagine, for example, that a country labors under poor institutions—like a lack of competitive and open markets—so that the incentives to invest in capital are low. Now suppose that new institutions are put into place; perhaps new leaders with better ideas replace the old guard. The new institutions increase the incentives to invest and the capital stock grows. But in a country without a lot of capital but good (or much improved) institutions, the marginal product of capital will be very high. In that case, even small investments pay big rewards and economic growth will be rapid.
This process describes what has happened in China. For most of the twentieth century, China labored under very poor economic institutions. China in the 1950s and 1960s was a growth disaster with mass starvation as a common occurrence. Since the death of Chairman Mao in 1976 and the subsequent move away from Communism and toward markets, China has been growing very rapidly. Chinese growth has been rapid because China began with very little capital, so the marginal product of capital was very high, and with the new reforms the investment rate increased dramatically. In addition, of course, China has benefited by opening up to trade and investment with the developed world.
China also grew rapidly because improved productivity in agriculture— brought about primarily by better institutions, as we discussed in the last chapter—meant that several hundred million Chinese rural peasants migrated to Chinese cities. Almost overnight these people went from being subsistence farmers, producing perhaps a few hundred dollars worth of output a year, to urban workers, producing perhaps a few thousand dollars worth of output a year in a factory. This is one of the largest economic migrations in human history and for the most part it has been a resounding success.
The iron logic explains why China is catching up to the United States but also why growth in China will slow. China now has its first tractor and indeed its second. As it adds a third and beyond, China’s growth rate will fall because the marginal product of capital will fall. Also, China has many problems—from a poor banking system to a lack of experience with the rule of law to a poorly educated population. At the moment, these problems are being swamped by the high productivity of capital. But as capital accumulates and the marginal productivity of capital declines, China’s problems will become more of a drag on Chinese growth.
Why Bombing a Country Can Raise Its Growth Rate The iron logic also explains why bombing a country can increase its growth rate. Following World War II, for example, Germany and Japan both grew faster than the United States. It may seem odd that the losers of a war should grow faster than the winners, but the iron logic of diminishing returns predicts exactly this result. During World War II, the capital stock of Germany and Japan—the factories, the roads, and the buildings—was nearly obliterated by Allied bombing. With so little capital remaining, any new capital was highly productive and meant that Germany and Japan had a strong incentive to put new capital into place. In other words, they grew rapidly as they were rebuilding their economies. It’s also the case that Germany and Japan had reasonably good postwar institutions.
But don’t make the mistake of envying Germany and Japan their high growth rates. Germany and Japan grew rapidly because they were catching up. Children who have been malnourished often grow rapidly when they are put on a proper diet but it’s not good to be malnourished. Similarly, countries whose capital stock has been destroyed will grow rapidly, all else being equal, as they catch up but it is not good to have your capital stock destroyed. Note also that growth in Germany and Japan slowed down as their capital stocks grew and approached U.S. levels; by the 1980s they were growing at close to the U.S. rate. The growth rate in Germany and Japan fell not because they did anything wrong but, again, because the marginal product of capital declines the more capital a country has.
Figure 8.1 explains that more capital means more output, albeit at a diminishing rate. But where does capital come from and where does it go? Capital is output that is saved and invested, but capital depreciates over time. In the next section, we show how these two aspects of capital—investment and depreciation—fit together. Understanding investment and depreciation will prove important for isolating the ultimate sources of economic growth.
Average Annual Growth Rate of GDP per Capita for Germany, Japan, and the United States
|
|
1950–1960 |
1980–1990 |
|
Germany |
6.6% |
1.9% |
|
Japan |
6.8% |
3.4% |
|
United States |
1.2% |
2.3% |
Capital Growth Equals Investment Minus Depreciation
Capital is output that is saved and invested rather than consumed. Imagine, for example, that 10 units of output are produced. Of the 10 units of output, 7 units might be consumed and 3 units invested in new capital. We write the fraction of output that is invested in new capital as gamma (γ), and in the example just given,  .
.
Figure 8.2 shows how output is divided between consumption and investment when γ = 0.3. Notice that when K = 100, 10 units of output are produced and of these 10 units, 7 units are consumed and 3 units are invested in new capital.
FIGURE 8.2
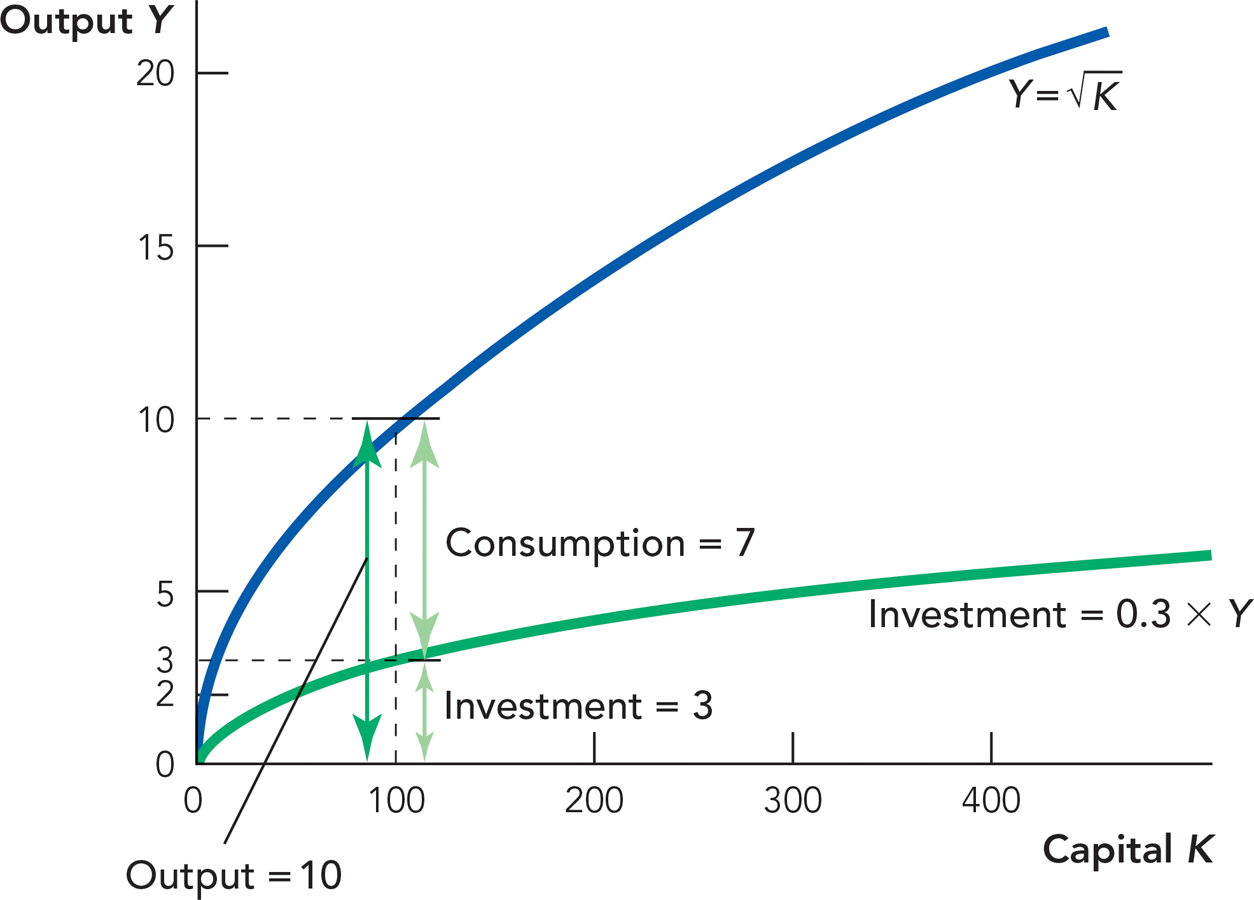
 shows how much output is produced for every level of K, the capital stock. When K = 100, 10 units of output are produced. The investment rate is 0.3 so 0.3 × 10 = 3 units of output are devoted to investment. The remaining 7 units of output are consumed.
Capital also depreciates—roads wear out, harbors become silted, and machines break down. Thus, if there are 100 units of capital in this period, for example, then 2 units might depreciate, leaving just 98 for use in the next period.
We write the fraction of capital that wears out or depreciates as delta (δ ); in the example just given,  . Figure 8.3 shows how much capital depreciates as a function of the capital stock. When the capital stock is 100, for example, then 2 units of capital will depreciate, and when the capital stock is 200, 4 units will depreciate, and so on.
FIGURE 8.3
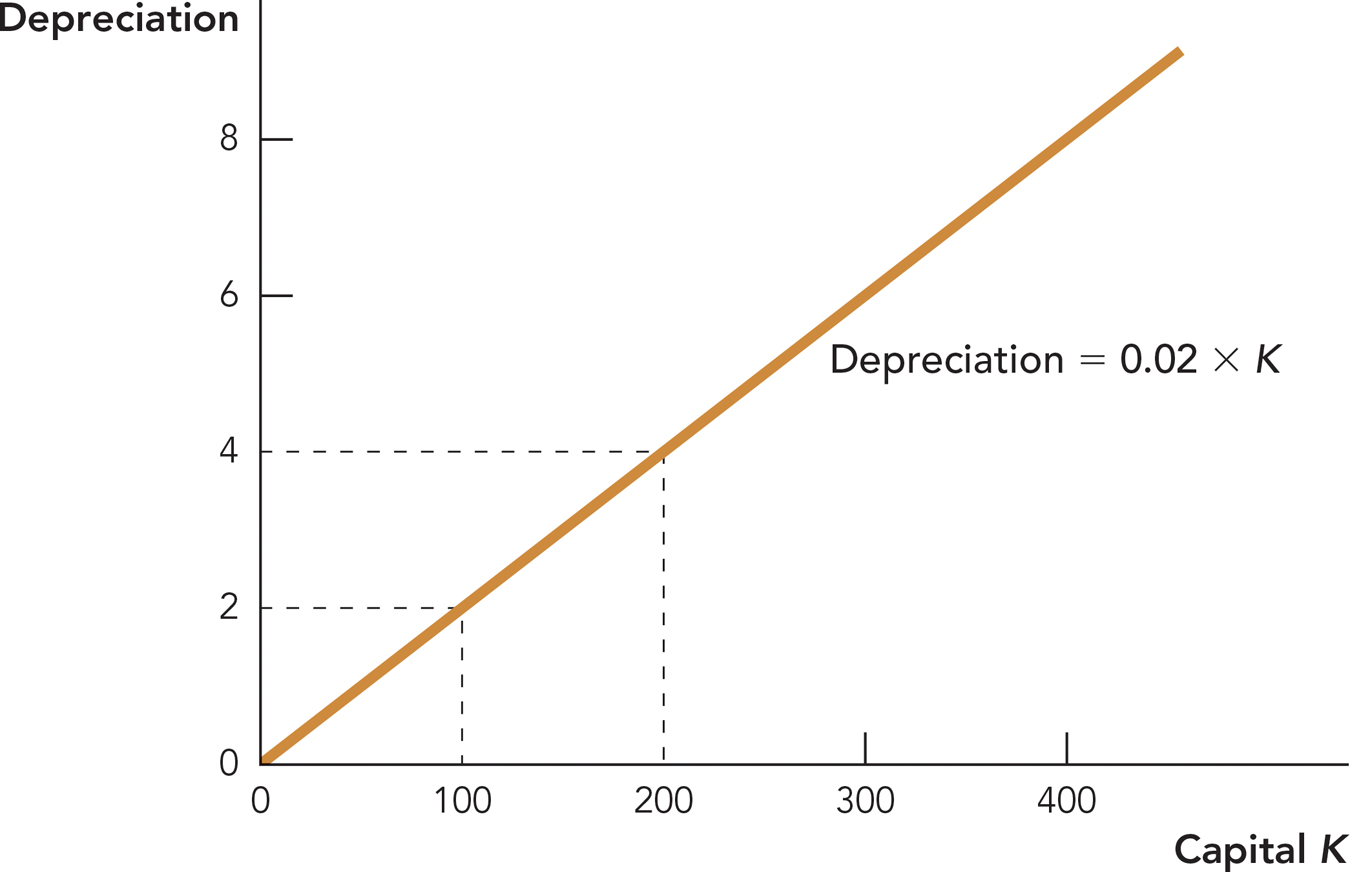
The greater the capital stock, the greater the depreciation, so a country with a lot of roads, harbors, and machines needs to devote a lot of resources to filling potholes, removing silt, and repairing and replacing. In other words, a successful economy must continually replenish its capital stock just to keep going. An economy that does not replenish its capital stock will quickly fall into ruin.
Again, Figure 8.3 shows that capital depreciation increases the greater the capital stock—this will turn out to place another constraint on economic growth.
Why Capital Alone Cannot Be the Key to Economic Growth
We now have everything we need to develop a second important insight from the Solow model. The greater the capital stock, the more capital will depreciate every period (more tractors = more tractor repairs). Thus, at some point, the capital stock will reach a level such that every unit of investment is needed just to replace the capital that depreciates in that period. When investment just covers capital depreciation, the capital stock stops growing, and when the capital stock stops growing, output stops growing as well. Thus, the iron logic of diminishing returns tells us that capital alone cannot be the key to economic growth. Let’s explain this in more detail.
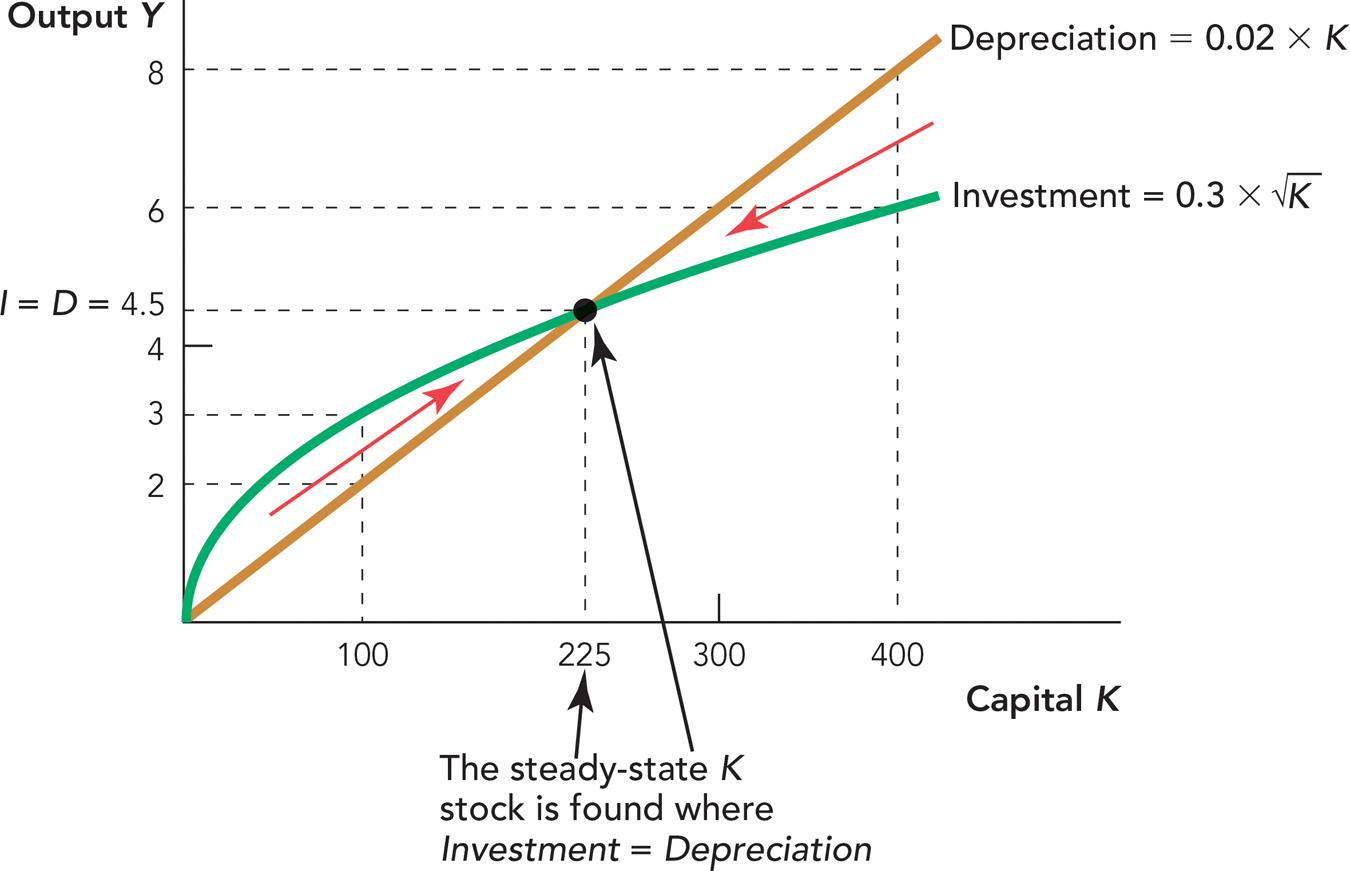
Figure 8.4 focuses attention on the two key functions, the investment function from Figure 8.2 and the depreciation function from Figure 8.3.
FIGURE 8.4
Check the Math
When K = 100,  ; of these 10 units 0.3 × 10 = 3 units are invested in new capital. Depreciation is 0.02 × 100 = 2 units so Investment (3) > Depreciation (2), and the capital stock and output grow.
Consider first a case where the capital stock grows larger. For instance, when K = 100, 3 units of output are invested in new capital and 2 units of capital depreciate. Investment exceeds depreciation so in the next period, both the capital stock and output will be larger. Thus, when investment is greater than depreciation (Investment > Depreciation), we have economic growth.
At the steady state the capital stock is neither increasing nor decreasing.
Investment increases as the capital stock gets larger, but because of the iron logic, investment increases at a diminishing rate. Depreciation, however, increases with the capital stock at a linear (constant) rate. Thus, at some point investment equals depreciation (Investment = Depreciation). At this point, every unit of investment is being used to replace depreciated capital, so the amount of net or new investment (investment after depreciation) is zero. We call this the steady-state level of capital. At the steady-state level of capital, there is no new (net) investment and economic growth stops.
Check the Math
As Figure 8.4 is drawn, the steady state occurs when K = 225 because

Thus when K = 225,
Investment = Depreciation.
Finally, suppose that the capital stock is 400. In this case, 8 units of capital would depreciate (.02 × 400 = 8) but only 6 units of capital would be invested  . As a result, when K = 400, not all the depreciated capital will be replaced and the capital stock will shrink.
We can summarize as follows:
Investment > Depreciation—The capital stock grows and output next period is bigger.
Investment = Depreciation—The capital stock and output are constant (the steady state).
Investment < Depreciation—The capital stock shrinks and output next period is smaller.
Human Capital
We learn from our “capital only” model that the economy will move towards a steady state in which there is no capital accumulation. Thus, long-run economic growth cannot be due to capital accumulation. The logic of diminishing returns means that eventually capital and output will cease growing. Economic growth, however, does not seem to be slowing. So what else could drive long-run economic growth? Let’s return to the other factors of production discussed in Chapter 7—human capital and technological knowledge.
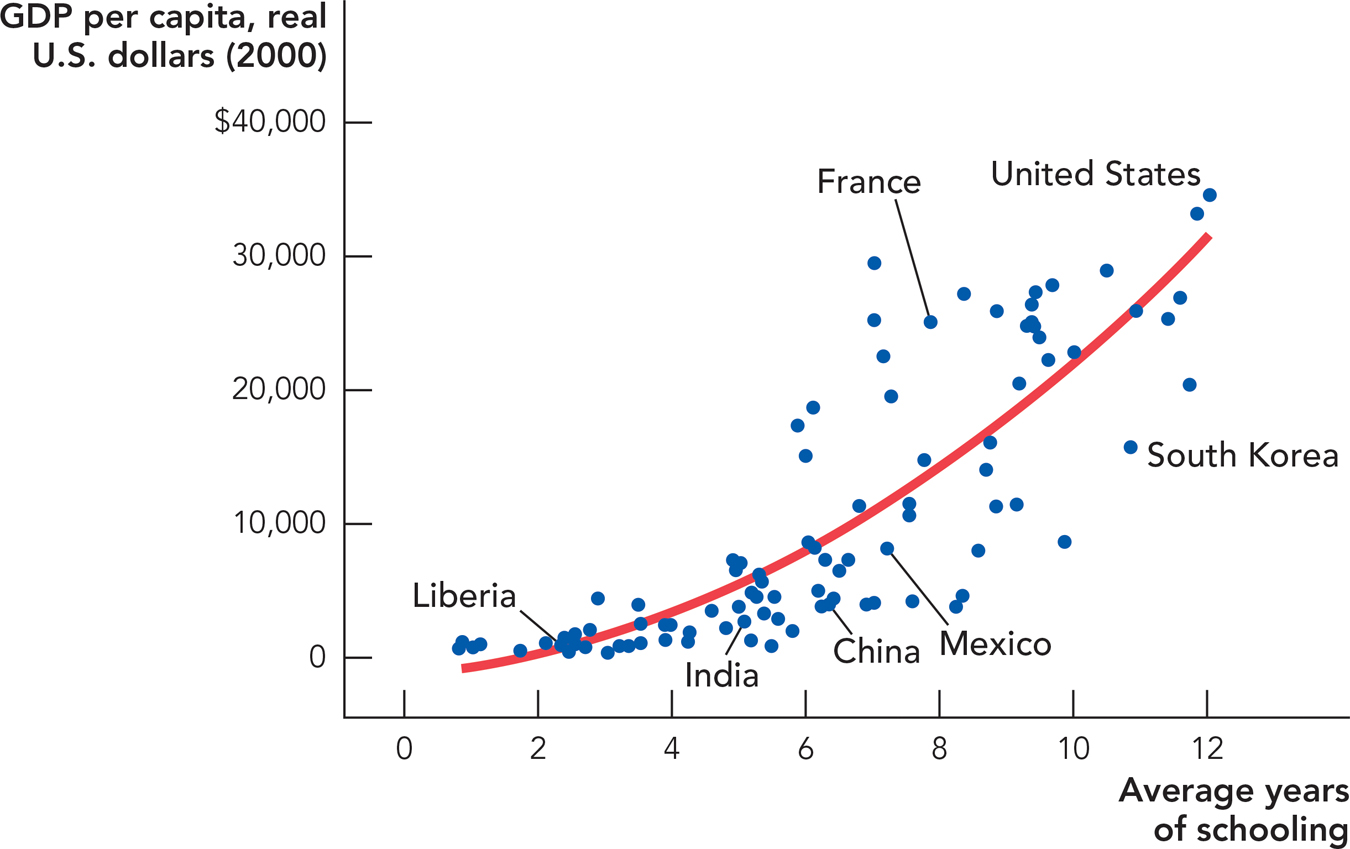
Can increases in human capital drive long-run economic growth? Human capital is an important contributor to the wealth of nations. Figure 8.5 shows that GDP per capita is higher in countries with more human capital, as measured by average years of schooling.
FIGURE 8.5
Source: Penn World Tables and Barro, Robert J., & Lee, Jong-Wha. 2001. International data on educational attainment: Updates and implications. Oxford Economic Papers, Oxford University Press 53(3): 541-563.
But human capital is just like physical capital in that it has diminishing returns and it depreciates. In other words, an economic principles class is probably the most important economics class that you will take and all the human capital in the world today will be gone in a hundred years. (Why will all the human capital in the world today be gone in a hundred years? Hint: Where will your human capital be in a hundred years?) Thus, within the Solow model, the logic of diminishing returns applies to human capital just as much as to physical capital and neither can drive long-run economic growth.
From Capital Accumulation to Catching-Up Growth
Finally, recall that changes in the capital stock drive output, so when Investment = Depreciation and K is at its steady-state level, then so is output. We show this in Figure 8.6 simply by adding the output curve back to our diagram. Notice that if K is at the steady-state level (K = 225, in this case), then Y will also be at a steady-state level of output, in this case 15. We take the 225 off the horizontal axis and bounce it off the  curve to get to GDP = 15 on the vertical axis. Similarly, since K drives Y, whenever K is growing, then so is Y. Thus, Figure 8.6 demonstrates in a little more detail than we had before that our theory of capital growth is also a theory of economic growth.
CHECK YOURSELF
In Figure 8.6:
Question 8.1
 What happens when the capital stock is 400?
Question 8.2
 What is investment?
Question 8.3
 What is depreciation?
Question 8.4
 What happens to output?
FIGURE 8.6
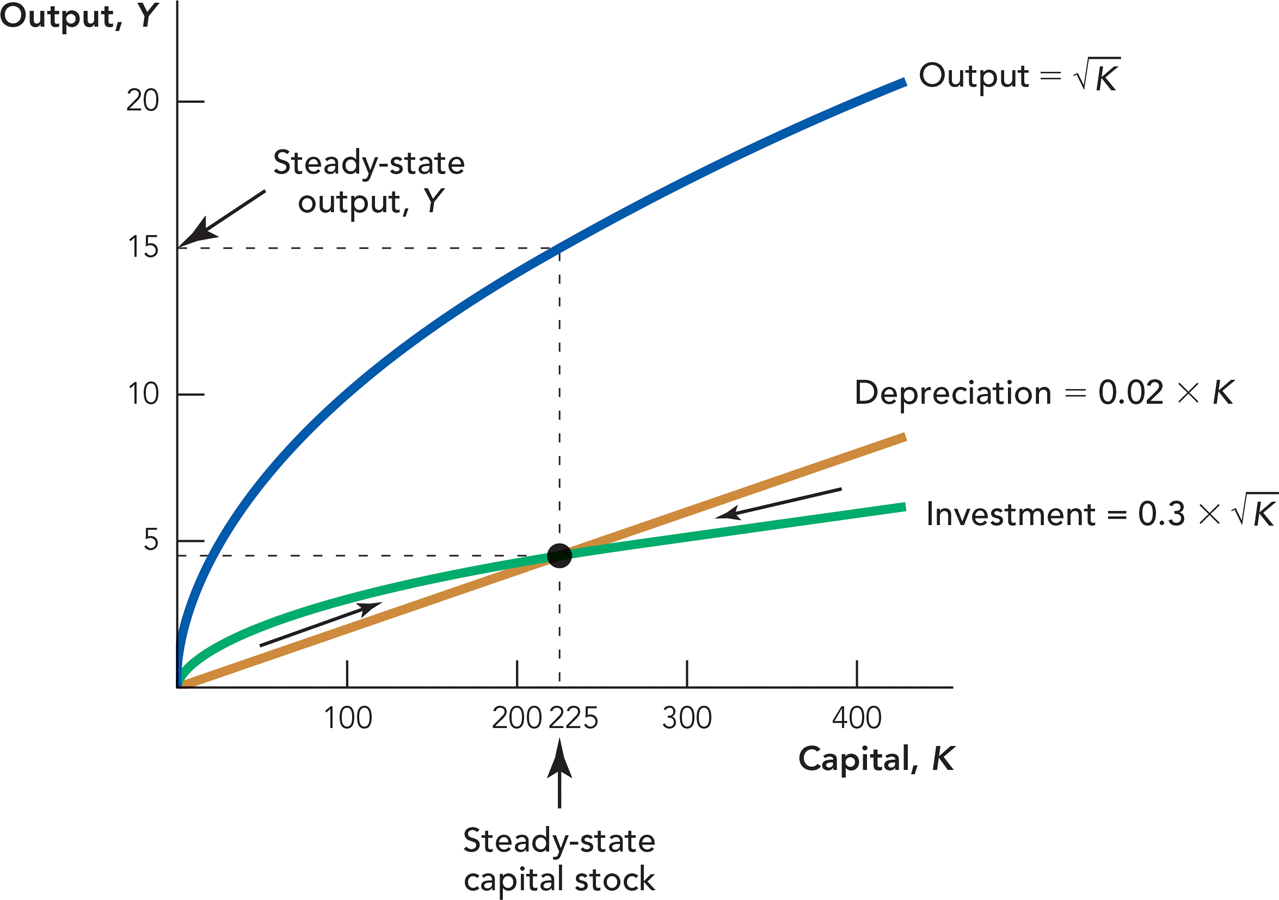
 = 15. At K = 225, Investment = Depreciation, so the capital stock is neither growing nor shrinking and thus output is neither growing nor shrinking.