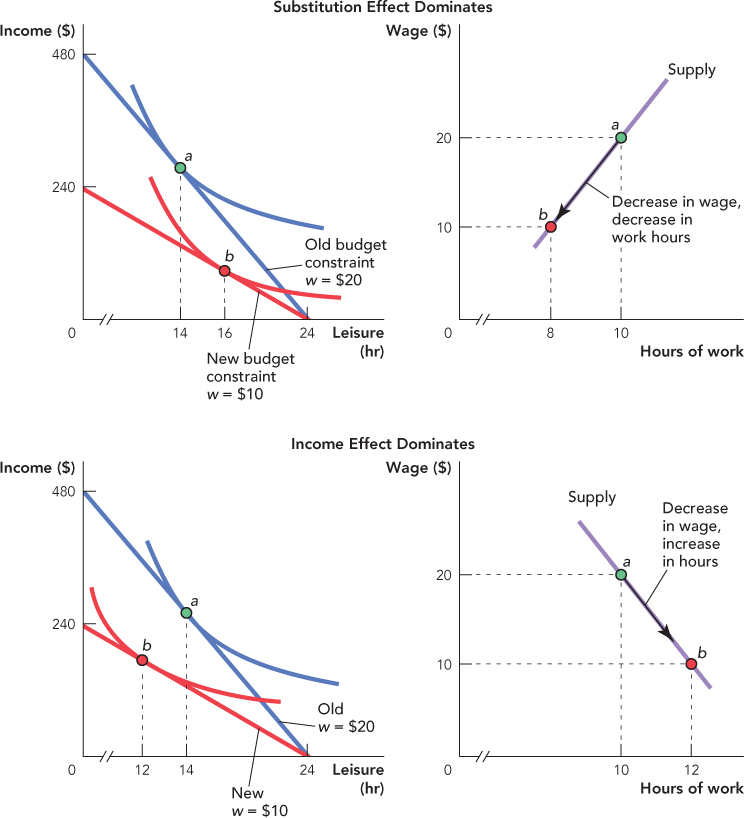
Income and Substitution Effects and the Labor Supply Curve A decrease in the wage can cause a worker to work fewer or more hours depending on the balance of the substitution and income effects. In the top left panel the substitution effect (not shown) dominates, so a decrease in the wage from $20 to $10 increases leisure from 14 hours a day to 16 (i.e., a decrease in work from 10 to 8 hours). The same information is shown in the top right panel but translated into a labor supply diagram. When the substitution effect dominates we get a positively sloped supply curve.
In the bottom left panel a decrease in the wage from $20 to $10 causes the worker to decrease leisure hours from 14 hours a day to 12 (i.e., an increase in work hours from 10 to 12 hours). The same information is translated into a labor supply diagram in the bottom right panel. When the income effect dominates we get a negatively sloped, or “backwardbending,” supply curve.
In the bottom left panel a decrease in the wage from $20 to $10 causes the worker to decrease leisure hours from 14 hours a day to 12 (i.e., an increase in work hours from 10 to 12 hours). The same information is translated into a labor supply diagram in the bottom right panel. When the income effect dominates we get a negatively sloped, or “backwardbending,” supply curve.