11 Costs and Profit Maximization Under Competition
CHAPTER OUTLINE
What Price to Set?
What Quantity to Produce?
Profits and the Average Cost Curve
Entry, Exit, and Shutdown Decisions
Entry, Exit, and Industry Supply Curves
Takeaway
Appendix: Using Excel to Graph Cost Curves
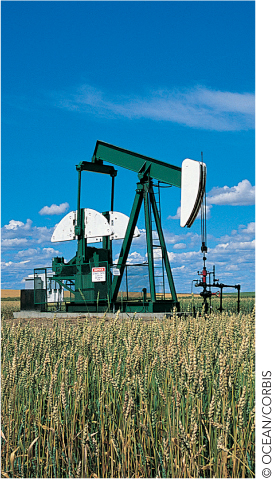
Drive through the Texas countryside and standing alone in a field of wheat, you will often see a nodding donkey. In Texas, a nodding donkey isn’t an animal but an oil pump. Most oil comes from giant oil fields, but in the United States there are over 400,000 “stripper oil wells,” oil wells that produce 10 barrels or less per day. That’s not much per well, but it adds up to nearly a million barrels of oil a day or about 19% of all U.S. production.1
Imagine that you are the owner of a stripper oil well and that you want to maximize your profit. Three questions present themselves:
 What price to set?
What quantity to produce?
When to enter and exit the industry?
These three questions are basic to any firm. In this chapter, we will be looking at how to answer these questions in a competitive industry. In later chapters, we will look at these questions for a monopolist.