CHAPTER 19 APPENDIXThe Tragedy of the Commons: How Fast?
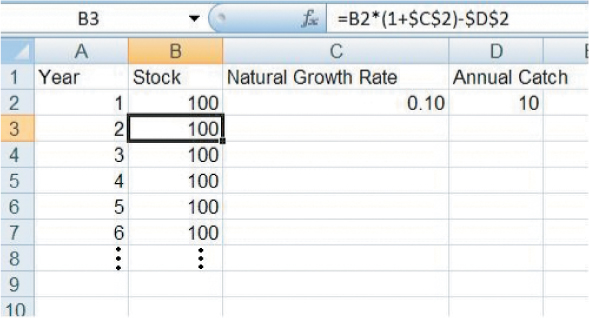
We can use a simple spreadsheet to see how quickly common resources can become tragically overexploited and ruined. Suppose that we start with a stock of 100. This could be 100 million fish or 100 thousand elephants, or 100 units of agricultural quality or other common resource. Let’s suppose that this resource grows or reproduces itself by 10% every year. We can then set up our spreadsheet as shown in Figure A19.1. The key cell is Cell B3, which contains the formula =B2*(1+$C$2)-$D$2. This formula takes the stock of fish in the previous year from cell B2, multiplies it by 1 plus the growth rate in Cell C2 (using the dollar signs to make sure that this cell reference stays the same when we copy it elsewhere), and then subtracts the annual catch or usage in Cell D2 (which we initially set at 10) to get the stock in this year.
FIGURE A19.1

We now copy and paste Cell B3 into Cells B4 onward. It’s fairly obvious that if a stock of 100 fish grows by 10% every year, then a catch of 10 is sustainable forever and this is what our spreadsheet indicates.
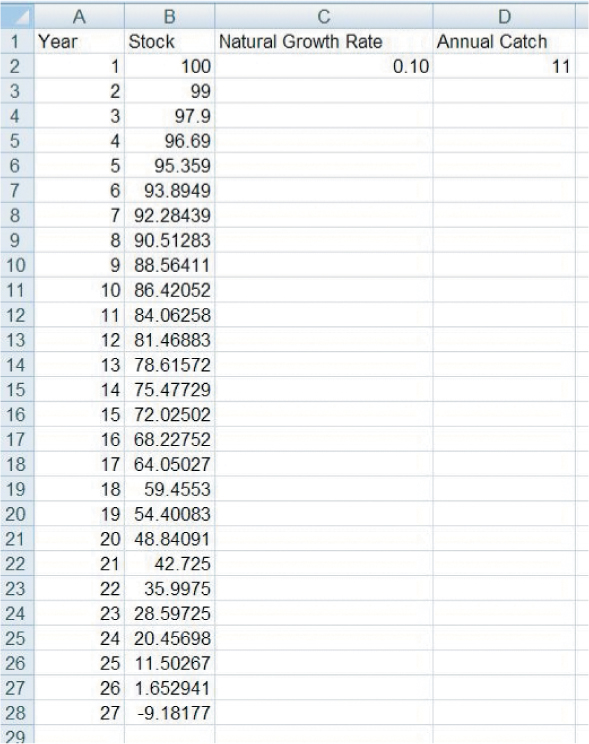
What is more surprising is how quickly an increase in the catch can drive a stock to extinction. If we change the annual catch in Cell D2 to 11, for example, we get the result in Figure A19.2.
FIGURE A19.2

Notice that the decline starts slowly, but by year 27 the stock of fish has gone negative; that is, the fish are extinct. You can experiment with different assumptions about growth rates and catches to see how long stocks can be sustained under different scenarios.