4 Equilibrium: How Supply and Demand Determine Prices
CHAPTER OUTLINE
Equilibrium and the Adjustment Process
A Free Market Maximizes Producer Plus Consumer Surplus (the Gains from Trade)
Does the Model Work? Evidence from the Laboratory
Shifting Demand and Supply Curves
Terminology: Demand Compared with Quantity Demanded and Supply Compared with Quantity Supplied
Understanding the Price of Oil
Takeaway
In Chapter 3, we introduced the supply curve and the demand curve. In that chapter, we wrote things like “if the price is $20 per barrel, the quantity supplied will be 50 million barrels per day (MBD)” and “if the price is $50, the quantity demanded will be 120 MBD.” But how is price determined?
We are now ready for the big event: equilibrium. Figure 4.1 puts the supply curve and demand curve for oil together in one diagram. Notice the one point where the curves meet. The price at the meeting point is called the equilibrium price and the quantity at the meeting point is called the equilibrium quantity.
FIGURE 4.1

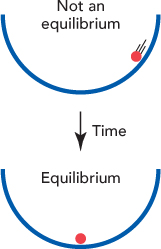
The equilibrium price is $30 and the equilibrium quantity is 65 MBD. What do we mean by equilibrium? We say that $30 and 65 are the equilibrium price and quantity because at any other price and quantity, economic forces are put in play that push prices and quantities toward these values. The equilibrium price and quantity are the only price and quantity that in a free market are stable. The sketch at right gives an intuitive feel for what we mean by equilibrium—the force of gravity pulls the ball down the side of the bowl until it comes to a state of rest. We will now explain the economic forces that push and pull prices toward their equilibrium values.