Who Ultimately Pays the Tax Does Not Depend on Who Writes the Check
Imagine that the government is considering a tax on apples. The government can collect the tax in either of two ways (assume that each method is equally costly to implement). The government can tax apple sellers $1 for every basket supplied, or they can tax apple buyers $1 for every basket of apples bought. Which tax scheme is better for apple buyers?
Surprisingly, the answer is that the tax has exactly the same effects whether it is “paid” for by sellers or “paid” for by buyers. Who ultimately pays a tax is determined not by the laws of Congress but by the laws of supply and demand.
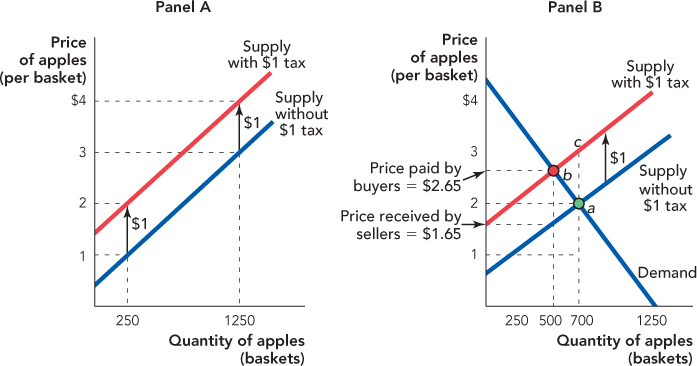
Let’s consider the effect of a $1 tax on apple sellers, which we analyze beginning with panel A of Figure 6.1. As discussed in Chapter 3, as far as sellers are concerned, a tax is the same as an increase in costs. Thus, if with no tax, sellers require a minimum of $1 per basket to sell 250 baskets of apples, then with a $1 tax they will require $2 per basket to sell the same quantity—$1 for their regular costs and $1 for their tax cost. Similarly, if with no tax, sellers require a minimum of $3 per basket to sell 1,250 baskets, then with a $1 tax they will require $4 per basket. Following through on this logic, we see that a $1 tax shifts the supply curve up at every quantity by exactly $1.
Panel B of Figure 6.1 adds a demand curve to show the effect of the tax on the market for apples. With no tax, the equilibrium is at point a with a price of $2 per basket and a quantity of 700. If apple sellers must pay a $1 tax for every basket supplied, the supply curve shifts up by $1 and the new equilibrium is at point b with a higher price of $2.65 and a smaller quantity consumed of 500.
FIGURE 6.1

Panel A: A $1 tax on apple sellers shifts the supply curve up by $1.
Panel B: A $1 tax on apple sellers shifts the supply curve up by $1, changing the equilibrium from point a to point b.
Students are sometimes surprised that a $1 tax does not necessarily raise the price by $1. To see why, imagine that the price did rise by $1. In that case, the price would rise to $3 at point c. But is point c an equilibrium?
No. Point c is not an equilibrium because at point c, the quantity supplied is greater than the quantity demanded. In other words, apple sellers in this market find that if they try to pass all of the tax onto apple buyers by raising the price to $3 per basket, there are not enough buyers to purchase 700 baskets, so sellers have excess supply. What incentives does this create? As they compete to obtain buyers, sellers must bid the price down. As the price falls, sellers supply fewer apples until the new equilibrium is reached at point b.
With the tax, buyers pay $2.65 per basket and sellers receive $1.65 per basket ($2.65 minus the $1 tax they must send to the government). Notice that the difference between the price that buyers pay and the price that sellers receive is equal to the tax. In fact, so long as the tax doesn’t drive the industry out of existence, it will always be the case that

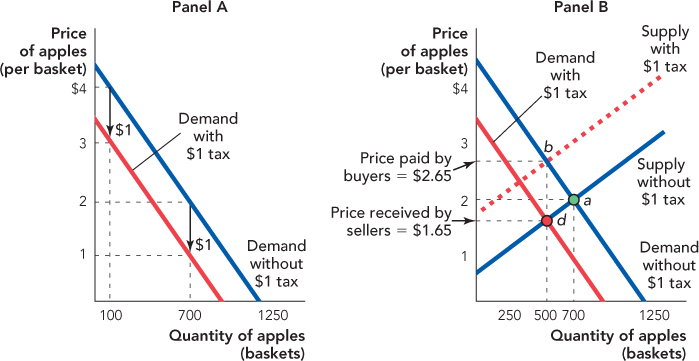
What happens if instead of taxing sellers, the government taxes buyers? We illustrate beginning with panel A of Figure 6.2. Imagine that before the tax buyers were willing to pay up to $4 per basket to purchase 100 baskets. If buyers must pay a $1 tax on top of the price, what is the most that they will now be willing to pay? Correct, $3. That is, if the buyers value the apples at $4 per basket but they must pay a tax of $1 to the government, then the most the buyers will be willing to pay the apple suppliers is $3 per basket (since the total price including the tax will now be $4). Similarly, if before the tax buyers were willing to pay up to $2 per basket to purchase 700 baskets, then after the $1 tax they will be willing to pay to the sellers at most $1 per basket for the same quantity. Following through on this logic, we see that a tax of $1 on buyers shifts the demand curve down at every quantity by $1.
Panel B shows the market for apples. With no tax, the equilibrium is at point a with a price of $2 and a quantity of 700. With the $1 tax on apple buyers, the demand curve shifts down by $1 and the new equilibrium is at point d with a price of $1.65 and a quantity of 500.
Notice that with the tax, apple buyers pay a total price of $2.65 ($1.65 in market price plus $1 tax) and apple sellers receive $1.65. In other words, the price buyers pay, the price sellers receive, and the quantity traded (500 baskets) are identical to what they were when the tax was placed on apple sellers.
FIGURE 6.2

Panel A: A $1 tax on apple buyers shifts the demand curve down by $1.
Panel B: A $1 tax on apple buyers shifts the demand curve down by $1, changing the equilibrium from point a to point d.

We can see what is going on by showing in panel B of Figure 6.2 a dotted supply curve, the supply curve if there were a $1 tax on sellers (exactly as in Figure 6.1). If the $1 tax is placed on sellers, the equilibrium is at point b. If the tax is placed on buyers, the equilibrium is at point d. The only difference between points b and d is that when the tax is placed on suppliers, the market price ($2.65) includes the tax, but when the tax is placed on buyers, the market price ($1.65) does not include the tax. The tax must be paid, however, so in either case the final price paid by buyers is $2.65 and the final price received by sellers is $1.65.
We have just shown something quite surprising. Who pays a tax does not depend on who must send the check to the government. Don’t be fooled; a tax on apple sellers has exactly the same effects as a tax on apple buyers.