Who Ultimately Pays the Tax Depends on the Relative Elasticities of Supply and Demand
We have just seen that whether the $1 apple tax is placed on buyers or sellers, the price to buyers ends up being $2.65 and the price received by sellers ends up being $1.65. But why is it that with the tax, buyers pay 65 cents more ($2.65 − $2), while sellers receive 35 cents less ($2 − $1.65)? What determines how the burden of the tax is shared between buyers and sellers? To answer this question, we introduce the wedge shortcut.
The Wedge Shortcut
The most important effect of a tax is to drive a tax wedge between the price paid by buyers and the price received by sellers. Recall that

FIGURE 6.3

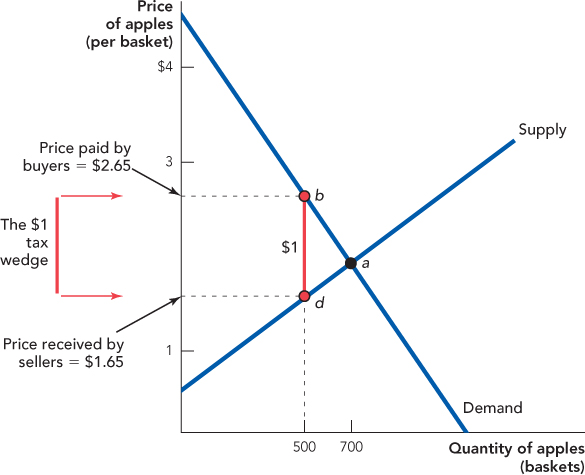
If we focus on the wedge aspect of a tax, we can simplify our tax analysis. In Figure 6.3, instead of shifting curves, we start with a tax of $1 and we “push” this vertical “tax wedge” into the diagram until the top of the wedge just touches the demand curve and the bottom of the wedge just touches the supply curve. The top of the wedge at point b gives us the price paid by the buyers ($2.65), the bottom of the wedge at point d gives us the price received by sellers ($1.65), and the quantity at which the wedge “sticks” is 500 baskets, exactly as before.
Using the wedge shortcut, we show that whether buyers or sellers pay a tax is determined by the relative elasticities of demand and supply. Recall from Chapter 5 that the elasticity of demand measures how responsive the quantity demanded is to a change in price and the elasticity of supply measures how responsive the quantity supplied is to a change in price. We show that when demand is more elastic than supply, demanders pay less of the tax than sellers. When supply is more elastic than demand, suppliers pay less of the tax than buyers.
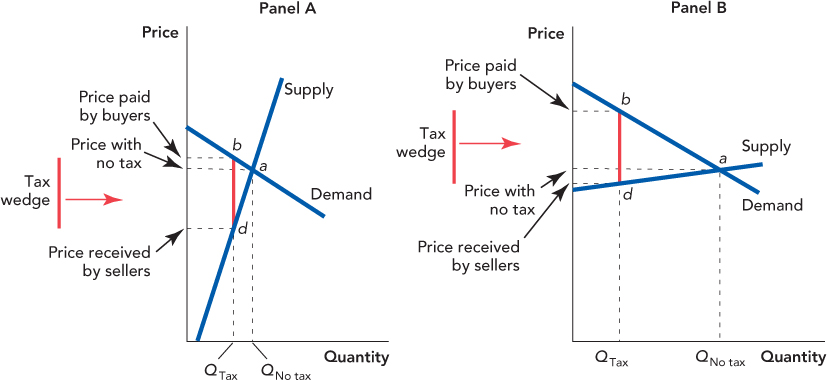
In panel A of Figure 6.4, we draw a demand curve that is more elastic than the supply curve. So who will pay most of the tax? Sellers. To see why sellers will pay most of the tax, push the tax wedge into the diagram. Notice that at the quantity that the tax wedge sticks, the price paid by buyers is only a small amount above the price with no tax. The price received by sellers, however, falls well below the price with no tax. Thus, when demand is more elastic than supply, buyers pay less of the tax than sellers.
In panel B of Figure 6.4, we draw a supply curve that is more elastic than the demand curve. So who will pay most of the tax? Buyers. To see why buyers will pay most of the tax, take the tax wedge and push it into the diagram. At the point that the wedge “sticks,” notice that the price paid by buyers has risen far above the price with no tax. The price received by sellers, however, has fallen only just below the price with no tax. Thus, when supply is more elastic than demand, buyers pay more of the tax.
FIGURE 6.4

Panel A: When demand is more elastic than supply, buyers pay less of the tax than sellers.
Panel B: When supply is more elastic than demand, suppliers pay less of the tax than buyers.
Elasticity = Escape
The intuition for these results is simple. An elastic demand curve means that demanders have lots of substitutes and you can’t tax someone who has a good substitute because they will just buy the substitute! Thus, when demand is elastic, sellers will end up paying most of the tax. An elastic supply curve has a similar interpretation. It means that the workers and capital in the industry can easily find work in another industry—so if you try to tax an industry with an elastic supply curve, the industry inputs will escape to other industries. Just remember, therefore, that elasticity = escape. So long as the industry is not taxed out of existence, someone must pay the tax, so whether buyers or sellers pay more depends on who can escape the best—that is, which curve is relatively more elastic.
Bearing in mind our rule that the more elastic side of the market can better escape the tax, let’s take a look at some taxes to see whether it is buyers or sellers who will bear the greater burden.
Health Insurance Mandates and Tax Analysis
One of the provisions of the 2010 Patient Protection and Affordable Care Act, popularly known as the Affordable Care Act (ACA) or “Obamacare,” was a mandate that required large employers to pay for employee health insurance or face a penalty. The ACA was modeled on a similar act passed in Massachusetts in 2006. It’s good to have health insurance, and it’s even better if someone else is paying for it. But who really pays? The ACA and Massachusetts laws required that firms buy health insurance for every full-time worker hired so we can think of these mandates as a tax on labor. Who pays the tax? As we now know, who pays more of the tax depends on whether supply or demand is more elastic. So consider, is it easier for firms to escape the tax by not employing or for workers to escape the tax by not working?
Can firms escape the tax? Yes, in a lot of ways. If the tax on labor gets too high, firms can substitute capital (machines) for labor, they can move overseas, or they can close up shop altogether. Can workers escape the tax? It’s not so easy. Most workers would continue to work even if their wages were lower because the costs of leaving the labor force are high. Thus, for most workers, the elasticity of labor supply is low (this is especially true for working-age men; men nearing retirement and married women tend to have higher elasticities of labor supply). The demand for labor, therefore, is likely to be more elastic than the supply of labor. Remember that when demand is more elastic than supply, then sellers (i.e., workers = sellers of labor) will pay most of the tax in the form of lower wages. This is the situation depicted in panel A of Figure 6.4.
In fact, studies of the Massachusetts mandate estimate that the wages of workers who gained health insurance because of the law fell by about the same amount as the cost of the coverage to firms.2 In other words, most of the burden of the law fell on workers through lower wages, exactly as our model predicts. In addition to an employer mandate, the national ACA also involves an individual mandate, taxpayer-funded subsidies for purchase of health insurance by low-income individuals, and expansion in taxpayer-funded Medicaid, so don’t take this as the last word on the distribution of the burden of the entire act, which is complicated.
Just because workers bear the costs of a law requiring firms to purchase health insurance, doesn’t mean that the law is a bad idea. It’s quite reasonable to want everyone in society to have health insurance and requiring employers to purchase health insurance is one way, albeit not necessarily the best way, to move toward this goal. What is important is that citizens not be fooled into thinking that the law is a free lunch at the expense of their employer. Tax analysis is useful because it helps us to see the true benefits and costs of economic policy and thus to choose wisely.
Who Pays the Cigarette Tax?
States tax cigarettes at rates ranging from $2.57 per pack in New Jersey to 7 cents per pack in South Carolina (2009 rates). Who ultimately pays the cigarette tax? Buyers or sellers? As usual, who pays depends on the relative elasticities of demand and supply.
As you might expect, given the addictive nature of nicotine, smokers have an inelastic demand for cigarettes, around −0.5. What about suppliers? Before you answer, remember that we are analyzing state cigarette taxes so the relevant question is how easily can a cigarette manufacturer escape a state tax?
A manufacturer can easily escape a state tax by selling elsewhere. In fact, because it’s so easy for a cigarette manufacturer to ship its product around the country, the elasticity of supply to any one state is very large, which means that buyers will bear almost all of the tax—as illustrated in panel B of Figure 6.4.

If the price paid by buyers increases by almost the amount of the tax, then the price received by sellers must be almost the same in all states regardless of the tax. To see why this makes sense, imagine what would happen if manufacturers earned less money per pack selling cigarettes in a high-tax state like New Jersey than in a low-tax state like South Carolina. If this happened, manufacturers would ship fewer cigarettes to New Jersey and more to South Carolina, and this would continue until the after-tax price was the same in both states.
We can easily test this theory. A pack of cigarettes sold for about $3.35 in South Carolina and $6.45 in New Jersey (2009), so the price to buyers was nearly twice as high in New Jersey as in South Carolina. But the after-tax price received by sellers was about the same, $3.28 in South Carolina ($3.35 − $0.07) vs. $3.88 in New Jersey ($6.45 − $2.57). (The small differences can probably be accounted for by other costs of doing business that differ between New Jersey and South Carolina.)
By the way, one argument for high cigarette taxes is that the government should discourage smoking. State taxes, however, are a bad method of discouraging smoking in the United States. A New Jersey tax will discourage smoking by residents of New Jersey but, as we have seen, to escape the NJ tax, cigarette manufacturers will ship more cigarettes to other states, which pushes cigarette prices down in those states, thereby increasing the quantity demanded. A New Jersey tax, therefore, will decrease smoking in New Jersey but this will be partially offset by increased smoking in other states. It’s more difficult for cigarette manufacturers to escape federal taxes than state taxes so if the goal is to reduce national consumption, a federal tax is superior to a state tax.