Analyzing Trade with Supply and Demand
Let’s look at trade—and trade restrictions—using tools that you are already familiar with: demand and supply.
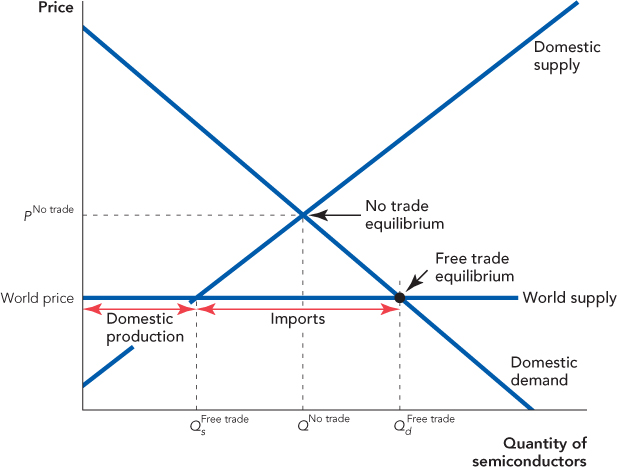
Figure 9.1 shows a domestic demand curve and a domestic supply curve for semiconductors. If there were no international trade, the equilibrium would be, as usual, at PNo trade, QNo trade. Suppose, however, that this good can also be bought in the world market at the world price. To simplify, we will assume that the U.S. market is small relative to the world market, so U.S. demanders can buy as many semiconductors as they want without pushing up the world price. In terms of our diagram, the world supply curve is flat (perfectly elastic) at the world price.
FIGURE 9.1

Given that U.S. consumers can buy as many semiconductors as they want at the world price, how many will they buy? As usual, we read the quantity demanded off the domestic demand curve so at the world price, U.S. consumers will demand  semiconductors. How many semiconductors will be supplied by domestic suppliers? As usual, we read the quantity supplied off the domestic supply curve so domestic suppliers will supply
  units. Notice that
  >
>  , so where does the difference come from? From imports. In other words, with international trade, domestic consumption is
  units;
  of these units are produced domestically and the remainder,
  –
–  , are imported.
Analyzing Tariffs with Demand and Supply
Protectionism is the economic policy of restraining trade through quotas, tariffs, or other regulations that burden foreign producers but not domestic producers.
Many countries, including the United States, restrict international trade with tariffs, quotas, or other regulations that burden foreign producers but not domestic producers—this is called protectionism. A tariff is simply a tax on imports. A trade quota is a restriction on the quantity of foreign goods that can be imported: Imports greater than the quota amount are forbidden or heavily taxed.
A tariff is a tax on imports.
A trade quota is a restriction on the quantity of goods that can be imported: Imports greater than the quota amount are forbidden or heavily taxed.
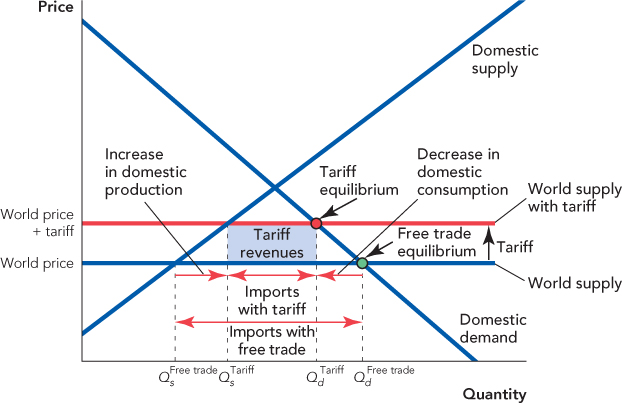
Figure 9.2 shows how to analyze a tariff. The figure looks imposing but it’s really the same as Figure 9.1 except that now we analyze domestic consumption, production, and imports before and after the tariff. Before the tariff, the situation is exactly as in Figure 9.1:  units are demanded,
  units are supplied by domestic producers, and imports are
  –
–  .
.
FIGURE 9.2

The government collects revenues from the tariff equal to the tariff × the quantity of imports, which is shown as the blue area.
The tariff is a tax on imports so—just as you learned in Chapter 3—the tariff (tax) shifts the world supply curve up by the amount of the tariff. For example, if the world price of semiconductors is $2 per unit and a new tariff of $1 per semiconductor is imposed, then the world supply curve shifts up to $3 per unit.
At the new, higher price of semiconductors, two things happen. First, there is an increase in the domestic production of semiconductors as domestic suppliers respond to the higher price by increasing production. In the diagram, domestic production increases from  to
to  . Second, there is a decrease in domestic consumption from
  to
to  as domestic consumers respond to the higher price by buying fewer semiconductors. Since the quantity produced by domestic suppliers rises and the quantity demanded by domestic consumers falls, the quantity of imports falls. Specifically, imports fall from
  –
–  to the smaller amount
  –
–  .
.
Figure 9.2 illustrates one more important idea. A tariff is a tax on imports so tariffs raise tax revenue for the government. The revenue raised by a tariff is the tariff amount times the quantity of imports (the quantity taxed). Thus, in Figure 9.2 the tariff revenue is given by the blue area.
