11-1 Gas and dust exist between the stars
Matter does indeed exist between the stars. We can see a relatively small amount of it through visible-light telescopes (Figure 11-1a); however, the bulk of it is too cold to be seen optically and requires the use of infrared (Figure 11-1b) and radio telescopes. We call all the matter between stars the interstellar medium, and it contains at least 10% of the observed mass in our Galaxy. Observations of the spectra of the interstellar medium reveal that it is composed of gas containing isolated atoms and molecules and tiny pieces of dust. Table 11-1 summarizes the composition of the interstellar medium.
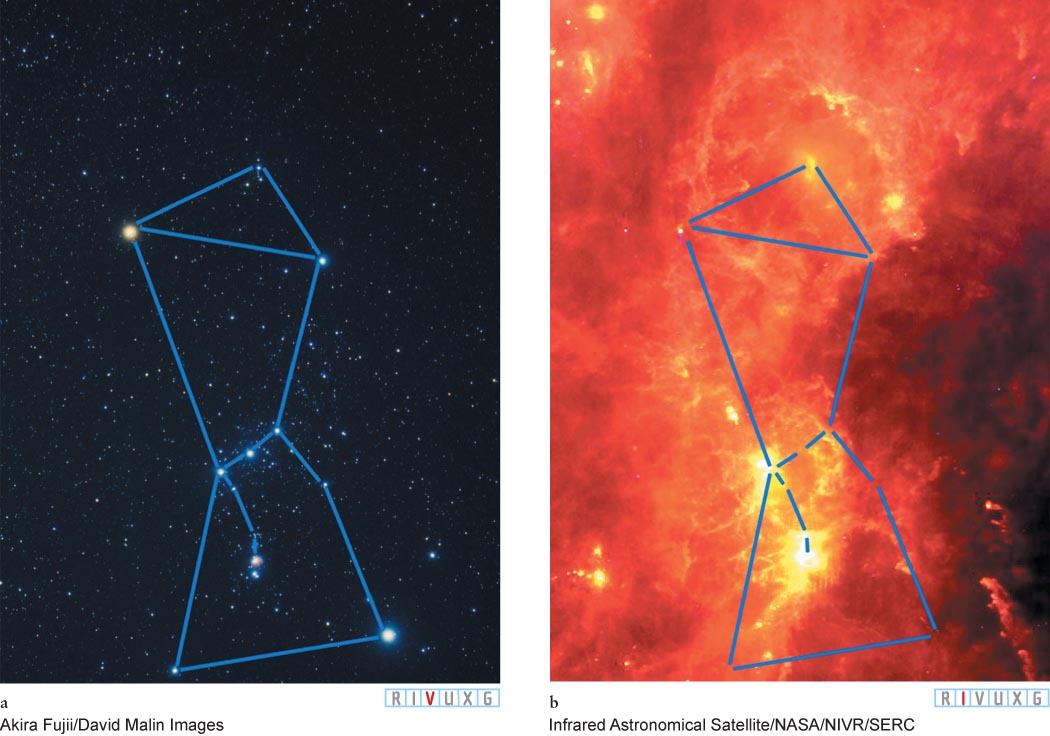
Figure 11-1: 
 Stars and the Interstellar Medium (a) The stars in the constellation Orion can easily be seen with the naked eye (see also Figure 1-4). A careful examination of the middle “star” in the “sword” of Orion (which hangs down below his belt) shows that it is not circular. This is actually the center of the Orion Nebula (also called the Great Nebula of Orion). This central region of the Orion Nebula is composed of several stars (the Trapezium) and surrounding gas and dust. This middle “star” in the sword appears fuzzy due to visible light emitted by a cloud of gas and dust surrounding the Trapezium stars there. Little other interstellar gas and dust can be seen in this visible-light image, although the leftmost star in Orion’s belt, Alnitak, is surrounded by gas and dust (see Figure 11-3). (b) The same region of the sky in a false-color infrared image taken by the Infrared Astronomical Satellite. Gases are seen here to exist in more areas than can be detected in visible light.
|
|
|
|
Hydrogen (atoms and molecules) |
|
|
|
|
|
|
|
|
|
|
| *In astronomy, all elements except hydrogen and helium are called metals. |
TABLE 11-1 COMPOSITION OF THE INTERSTELLAR MEDIUM
More than 200 different types of molecules have been discovered in interstellar space, some with as many as 60 molecules bonded together. Among these are molecular hydrogen (H2), carbon monoxide (CO), carbon dioxide (CO2), water (H2O), ammonia (NH3), formaldehyde (H2CO), the sugar glycoaldehyde (C2H4O2), and the 60-carbon-atom buckminsterfullerene (commonly called buckyballs). We can identify these molecules by their unique spectral emissions, just as we can identify elements from atomic spectra.
The dust found in space also has a variety of structures. Some carbon-based (that is, organic) particles out there are typically 0.005 micron (μm) across (10,000 times smaller than the diameter of a typical human hair). Much larger pieces of space dust have cores of carbon or silicon compounds surrounded with mantles of ice and other materials. These grow to more than 0.30 μm in diameter (still nearly 200 times smaller than the diameter of a human hair).
Working with the knowledge that new stars form from the gas and dust of the interstellar medium, astronomers map this matter to identify places to look for young stars. When it can be seen in the visible part of the spectrum, the gas and dust in the interstellar medium glow as a result of scattered light from stars in the vicinity, as seen in Figure 11-1a. As another example, the interstellar medium is dramatically highlighted by stars in the Pleiades star cluster (Figure 11-2a) located in the constellation Taurus. The bluish haze, starlight scattered by the interstellar gas and dust, is called a reflection nebula. A nebula (plural, nebulae) is a dense region of interstellar gas and dust. Nebulae are often embedded in much larger bodies of gas and dust, called molecular clouds. The largest molecular clouds, called giant molecular clouds, contain upward of a million solar masses of matter and extend up to about 600 light-years across.
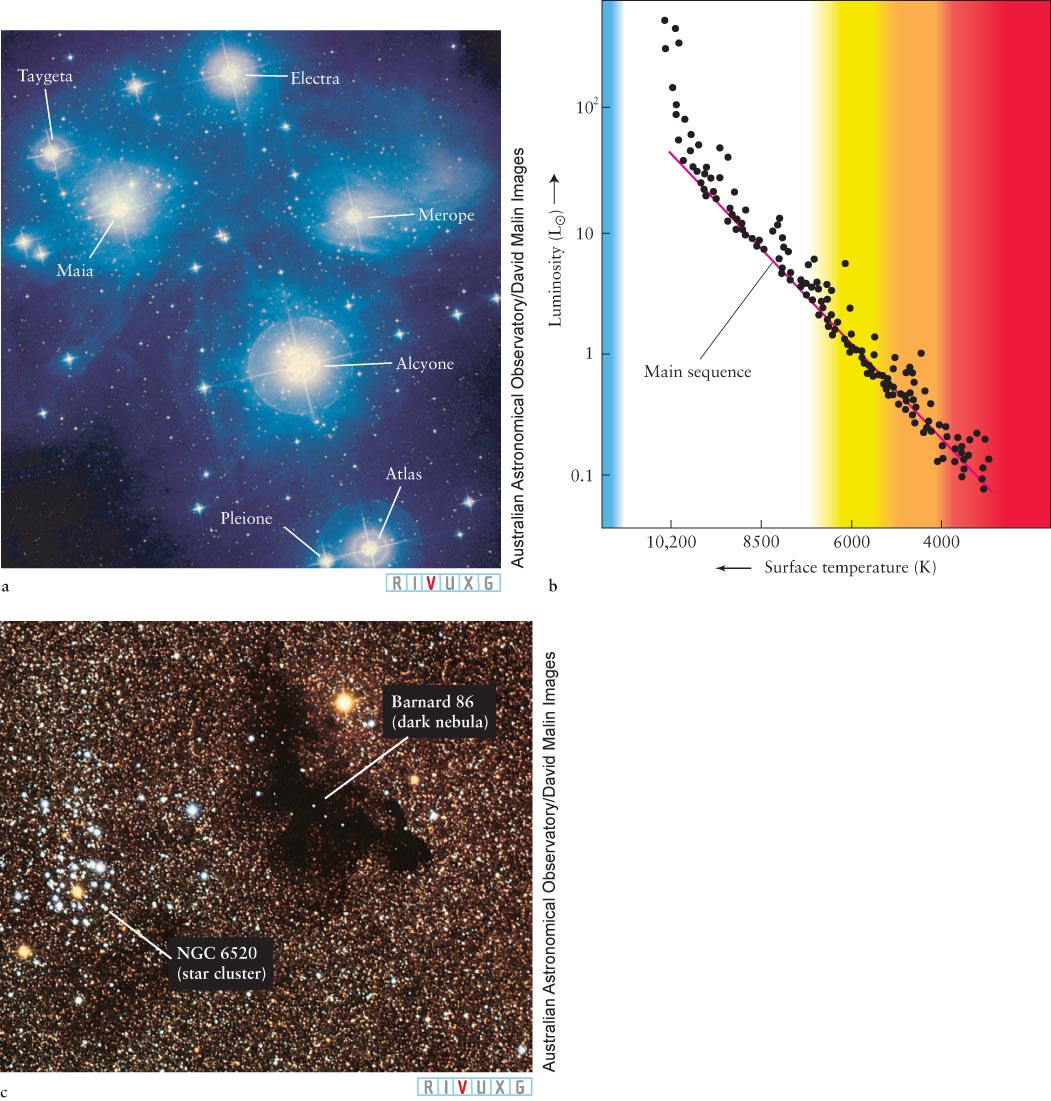
Figure 11-2:
A Reflection Nebula and Dark Nebula (a) This open cluster, called the Pleiades, can easily be seen with the naked eye in the constellation Taurus (the Bull). Pleiades lies about 440 light-years (134 pc) from Earth. The stars are not shedding mass, unlike the stars in Figures 11-13a and 11-21. The blue glow surrounding the stars of the Pleiades is a reflection nebula created as some of the stars’ radiation scatters off preexisting dust grains in their vicinity. (b) Each dot plotted on this H-R diagram represents a star in the Pleiades whose luminosity and surface temperature have been determined. Note that most of the cool, low-mass stars have arrived at the main sequence, indicating that hydrogen fusion has begun in their cores. The cluster has a diameter of about 5 light-years, is about 100 million years old, and contains about 500 stars. (c) The dark nebula Barnard 86 is located in Sagittarius. It is visible in this photograph simply because it blocks out light from the stars beyond it. The bluish stars to the left of the dark nebula are members of a star cluster called NGC 6520.
Focus Question 11-1
The interstellar medium is composed primarily of what kinds of things?
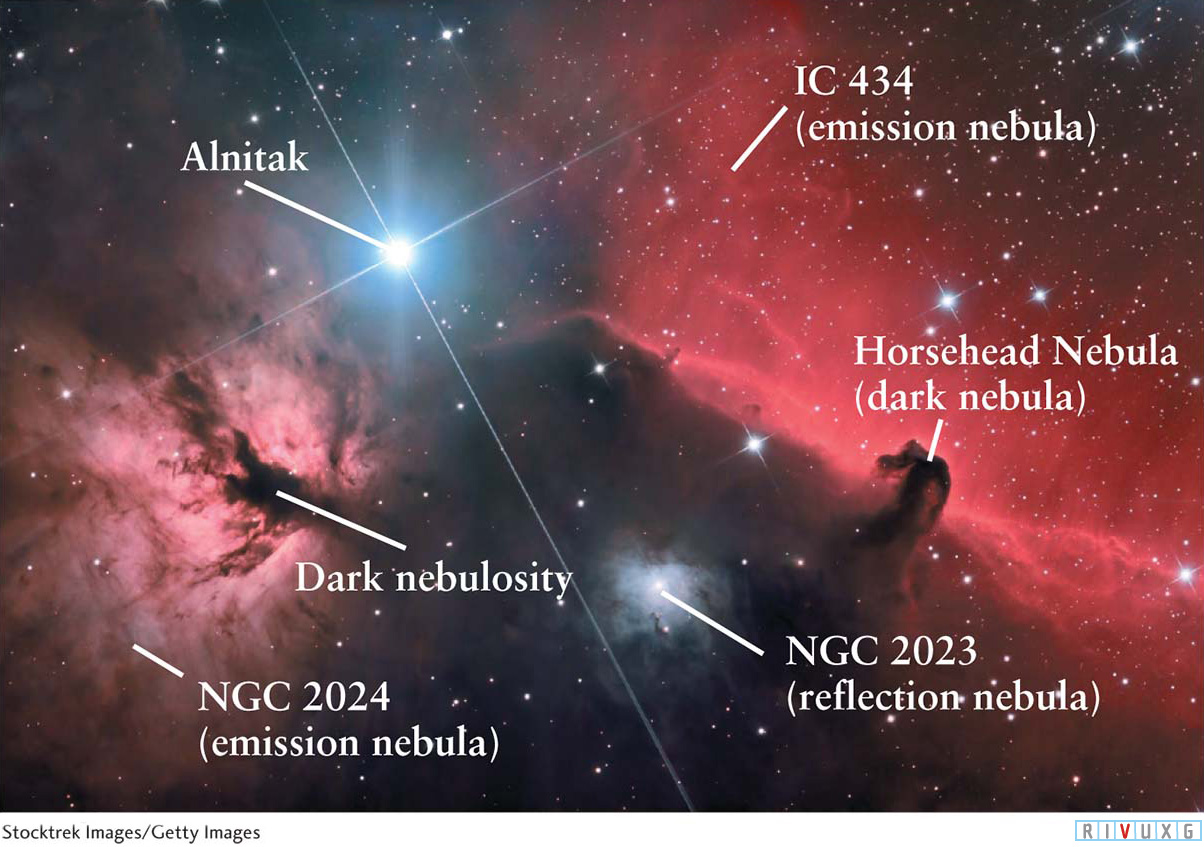
Figure 11-3:
A Gas- and Dust-Rich Region of Orion A variety of nebulae appear in the sky around Alnitak, also called ζ (zeta) Orionis, the easternmost star in the belt of Orion. To the left of Alnitak is a bright, red emission nebula, called NGC 2024. The glowing gases in emission nebulae are excited by ultraviolet radiation from young, massive stars. Dust grains obscure part of NGC 2024, giving the appearance of black streaks, while the distinctively shaped dust cloud, called the Horsehead Nebula, blocks the light from the background nebula IC 434. The Horsehead Nebula is part of a larger complex of dark interstellar matter, seen in the bottom center of this image. To the left of the Horsehead Nebula is the reflection nebula NGC 2023, whose dust grains scatter blue light from stars between us and it more effectively than any other color. All of this nebulosity lies about 1600 light-years from Earth, while the star Alnitak is only 815 light-years away from us. NGC refers to the New General Catalog of stars and IC stands for Index Catalogs, two supplements to the NGC.
Astronomers identify several other types of nebulae. Most important among these are dark nebulae and emission nebulae. Dark nebulae (Figure 11-2b) are regions of interstellar gas and dust that are sufficiently dense to prevent most of the visible light from behind them from getting to us. They look like regions of empty space, whereas they are actually among the densest of interstellar nebulae. Emission nebulae are regions of interstellar gas and dust that glow from energy they receive from nearby stars, from exploding stars, and from collisions between nebulae (Figure 11-3).
While the effect of a dark nebula is an extreme case, finding more distant gas and dust in space is always difficult because the nearby interstellar medium dims, or even blocks, light from behind it. The same effect occurs on Earth where thin cloud layers in our night sky dim the starlight and even prevent us from seeing the stars behind them. This darkening of light by intervening gas and dust in space is called interstellar extinction. Dark nebulae are extreme examples of interstellar extinction.
Even when we can see a star or other object at visible wavelengths through the interstellar medium, it appears redder than it actually is, a phenomenon called interstellar reddening. This effect occurs because short-wavelength starlight is scattered by dust grains more than is long-wavelength light. (Violet is scattered most, followed by blue, green, yellow, and orange, with red scattered least.) Therefore, when we observe a star through gas and dust, we are seeing less short-wavelength light from it than we would if the interstellar medium were not there (Figure 11-4a). The more dust between the objects and us, the redder the objects appear (Figure 11-4b). Interstellar reddening is different from reddening due to the Doppler shift (see Section 3-2). The Doppler shift causes all wavelengths of electromagnetic radiation to lengthen equally, whereas interstellar reddening, due to the stronger scattering of shorter wavelengths, does not change the wavelengths of the starlight we receive—only their intensities.
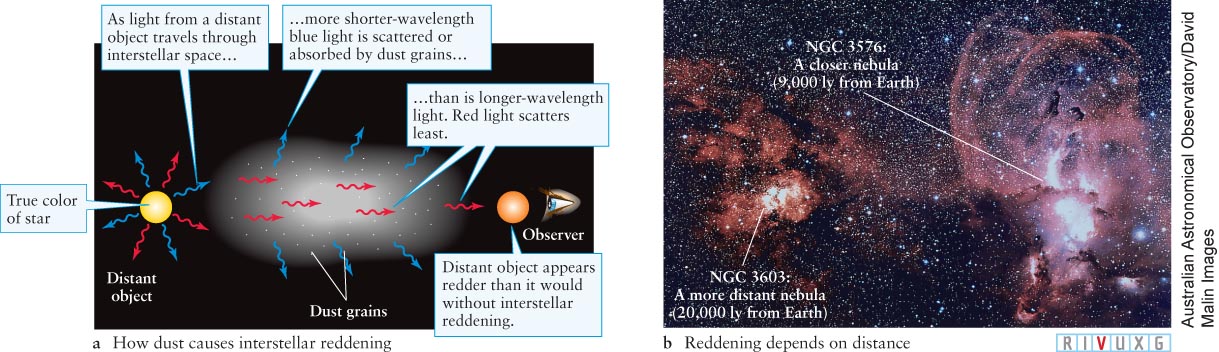
Figure 11-4:
Interstellar Reddening (a) Dust in interstellar space scatters more short-wavelength (blue) light passing through it than longer-wavelength colors. Therefore, stars and other objects seen through interstellar clouds appear redder than they would otherwise. (b) Light from these two nebulae passes through different amounts of interstellar dust and therefore they appear to have different colors. Because NGC 3603 is farther away, it appears a ruddier shade of red than does NGC 3576.
We have been able to discover distant stars and clouds of interstellar gas and dust whose visible light is obscured by the nearby interstellar medium because the distant objects also emit radio or infrared photons that are scattered relatively little on their way to us. Likewise, we use radio and infrared telescopes to find nearby interstellar gas and dust that, as blackbodies, are too cold to emit much visible light.
Stars form from gas and dust that become Jeans unstable (see Section 4-2). Most of this matter is hydrogen in the form of molecules (rather than atoms). However, molecular hydrogen is relatively hard to detect in space. Therefore, radio astronomers often search for cold interstellar gas in the form of carbon monoxide (CO), which emits lots of photons at short radio (microwave) wavelengths of 2.6 and 1.3 mm. Calculations based on the known abundances of interstellar elements reveal that there are about 10,000 hydrogen molecules (H2) for every CO molecule in the interstellar medium. Consequently, wherever astronomers detect strong emission of CO, they deduce that an enormous amount of molecular hydrogen gas must also be present.
In mapping the locations of CO emission, astronomers came to realize that interstellar gas and dust are often concentrated in giant molecular clouds. In some cases, these clouds appear as dark nebulae silhouetted against a glowing background light, such as Orion’s famous Horsehead Nebula (Figure 11-3). In other cases, the clouds appear as dark nebulae that obscure the background stars (Figure 11-2b). Some 6000 giant molecular clouds are estimated to exist in our Milky Way Galaxy and have masses that range from 105 to 2 × 10⁶ M⊙ with diameters that range from 15 to 600 light-years. The density inside each of these clouds ranges from 102 to 105 hydrogen molecules per cubic centimeter— thousands of times greater than the average density of the gas and dust dispersed throughout interstellar space, but some 1015 times less dense than the air we breathe. Having located interstellar matter, we will now consider why some of this gas and dust becomes Jeans unstable and, therefore, collapses to form new stars (and planets). We explore this activity by expanding on the material in Section 4-2.
11-2 Supernovae, collisions of interstellar clouds, and starlight trigger new star formation
We will see in detail in Chapter 13 that a supernova is a violent detonation that ends the life cycle of a massive star. The core of the doomed star collapses in a matter of seconds, releasing vast quantities of particles and energy that blast the star’s outer layers into space at speeds of several thousand kilometers per second.
 Astronomers have found the ashes (more properly, the gas and dust) of many such dead stars scattered across the sky. These supernova remnants are another type of nebula. Supernova remnants, like the Cygnus Loop shown in Figure 11-5, have a distinctly arched appearance, as would be expected for an expanding shell of gas and dust. As it passes through the surrounding interstellar medium, the supernova remnant collides with preexisting matter, exciting the electrons in the atoms and molecules there, causing the gases to glow. If the expanding shell of a supernova remnant rams into a giant molecular cloud with sufficient speed, it can compress that cloud, making pieces of it Jeans unstable and thus stimulating star birth in it. As we learned in Chapter 4, there is evidence that such an event happened around the time the solar system formed.
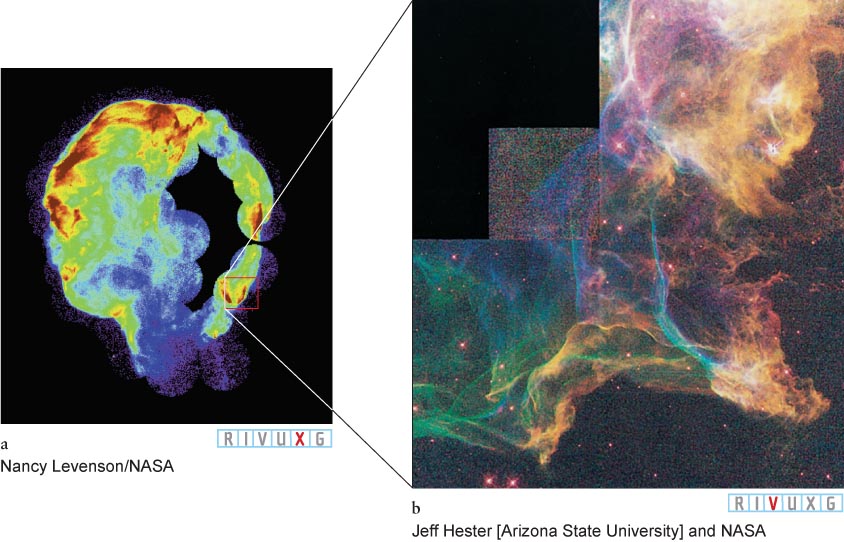
Figure 11-5:  A Supernova Remnant (a) X-ray image of the Cygnus Loop, the remnant of a supernova that occurred nearly 20,000 years ago. The expanding spherical shell of gas now has a diameter of about 120 light-years. The entire Cygnus Loop has an angular diameter in our sky 6 times wider than the Moon. (b) This visible-light Hubble Space Telescope image of part of the Cygnus Loop shows emission from different atoms false-color-coded with blue from oxygen, red from sulfur, and green from hydrogen.
A simple collision between two interstellar clouds can also create regions that are Jeans unstable so that they collapse and form new stars. Likewise, radiation from O and B stars, which are especially bright and hot, will ionize (remove electrons from their atomic orbits) the gas that surrounds them, which then moves away and compresses the nearby interstellar medium (Figure 11-6).
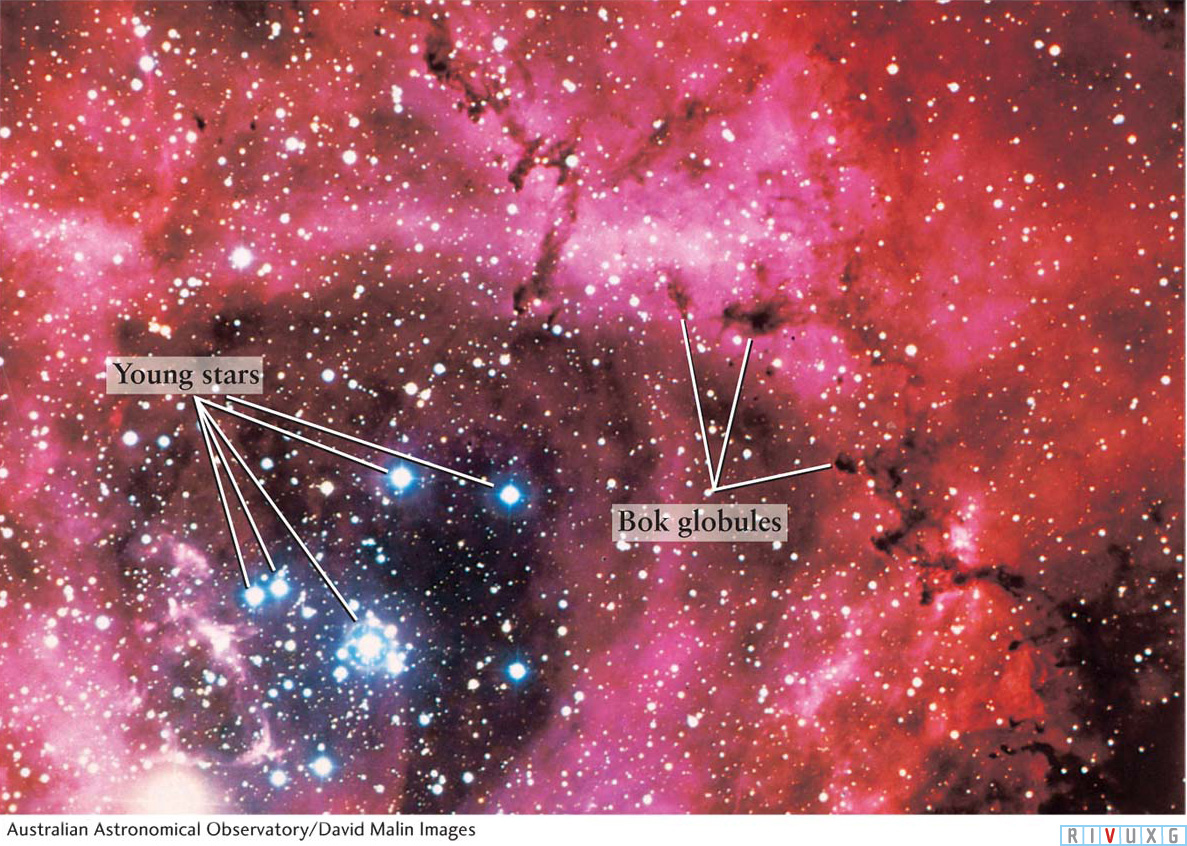
Figure 11-6:
The Core of the Rosette Nebula The large, circular Rosette Nebula (NGC 2237) is near one end of a sprawling giant molecular cloud in the constellation Monoceros (the Unicorn). Radiation from young, hot stars has blown gas away from the center of this nebula. Some of this gas has become clumped in Bok globules that appear silhouetted against the glowing background gases. New star formation is taking place within these globules. The entire Rosette Nebula has an angular diameter on the sky nearly 3 times that of the Moon, and it lies some 3000 light-years from Earth.
 As small regions of a giant molecular cloud become Jeans unstable and collapse, they become denser, preventing light from behind and inside them from escaping. These darker regions are called Bok globules (Figure 11-7a, see also Figure 11-6), named after astronomer Bart Bok, who first studied them in the 1940s. Infrared observations show compact regions of gas and dust, called dense cores, inside Bok globules. These cores are destined to become stars, as their gravity pulls their matter inward.
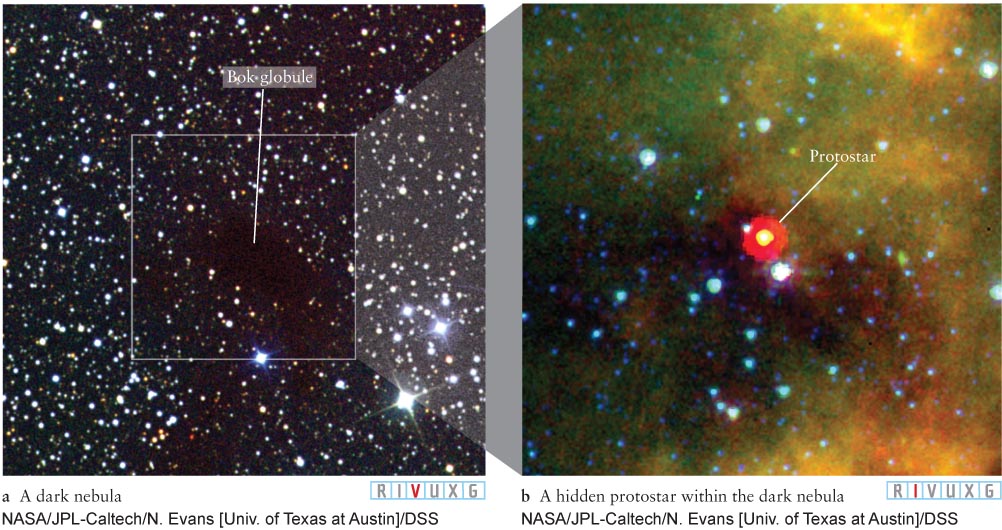
Figure 11-7:
Protostar in a Bok Globule (a) This visible-light image shows a small dark nebula (equivalently, a Bok globule) called L1014 located in the constellation Cygnus. (b) When viewed in the infrared, a protostar is visible within the nebula.
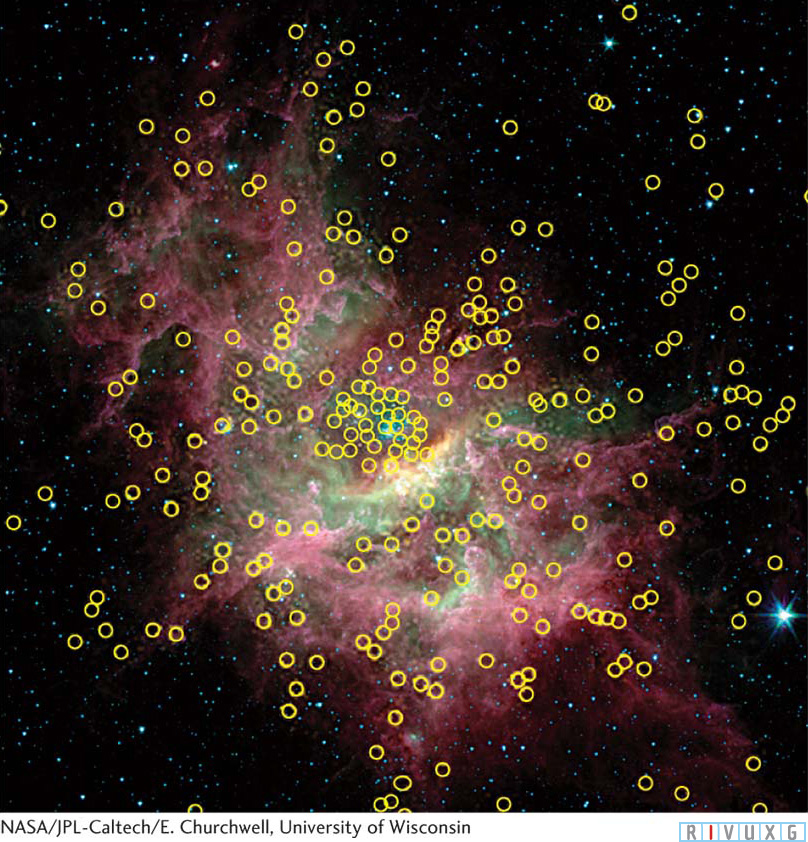
Figure 11-8:
A Cluster of Protostars More than 300 protostars (yellow circles) were observed in the infrared by the Spitzer Space Telescope. This cluster of newly forming stars is 13,700 light-years away in the constellation Centaurus. The nebula, some of whose gas is being converted into stars, is called RCW 49 and contains more than 2200 stars and protostars. Most of the interior of this nebula is hidden from our eyes by the dust it contains.
Often a giant molecular cloud has several hundred or even thousands of dense cores. In that case, hundreds or thousands of stars form together. Such stellar nurseries will become open clusters of stars like the Pleiades (see Figure 11-2). Open clusters are gravitationally unbound systems, meaning that the stars in them eventually drift apart. As noted in Chapter 4, it is likely that the solar system formed in an open cluster.
At first, a collapsing dense core is just a cool, dusty region thousands of times larger than our solar system. The dense core actually collapses from the inside out. The inner region falls in rapidly, leaving the outer layers of the dense core to drift in at a more leisurely rate. This process of increasing mass in the central region is called accretion, and the newly forming object at the center is called a protostar (Figure 11-7b). The formation of stars with different masses depends, in part, on the density of the interstellar medium from which the stars form. Denser gas in a Bok globule can lead to a more massive star forming there, provided that the globule has enough total mass.
Although fusion has not begun, a protostar emits energy, some of which comes from the compression and heating of its interior caused by the gravitational force from its growing mass of hot gas. However, most of the energy it releases comes from infalling gases colliding with the surface gas of the protostar. Figure 11-8 is an infrared image showing the locations of myriad protostars in and around a nebula in Centaurus.
If a dense core is not spinning, it collapses into a sphere, which ultimately becomes an isolated star. If a dense core is spinning, it collapses into a disk, which may then condense into two or three stars. Or, if the disk has a low enough mass, it may become a single star with orbiting protoplanets, as we discussed in Chapter 4.
11-3 When a protostar ceases to accumulate mass, it becomes a pre–main-sequence star
Focus Question 11-2
What types of events can initiate the process of star formation?
Focus Question 11-3
Why can’t protostars be observed with visible-light telescopes?
Protostars are physically larger than the main-sequence stars into which they are evolving. A protostar of 1 M⊙, for example, has about 5 times the diameter of the Sun. Because of their large sizes, protostars emit great quantities of radiation and gas (analogous to solar wind), and they can be observed as sources of infrared radiation. At this point, they cannot be seen in visible light because they are enshrouded by their outer layer of gas and dust (see Figure 11-7b). Much matter is still slowly falling inward from the dense core’s outer shell. Eventually, the radiation and particles that flow off the protostar exert enough outward force to halt the infall of this gas and dust. As a result, mass accretion stops, and the protostar becomes a pre–main-sequence star.
A pre–main-sequence star contracts slowly, unlike the rapid collapse of a protostar. When the temperature at its core reaches 107 K, hydrogen fusion begins. As we saw in Section 9-7, this thermonuclear process releases enormous amounts of energy. The outpouring of energy from hydrogen fusion creates enough pressure inside the pre–main-sequence star to stop its contraction. In the final stages of pre–main-sequence evolution, the outer shell of gas and dust finally dissipates (Figure 11-9; see also Figure 11-6). For the first time, the star is revealed via visible light to the outside universe.
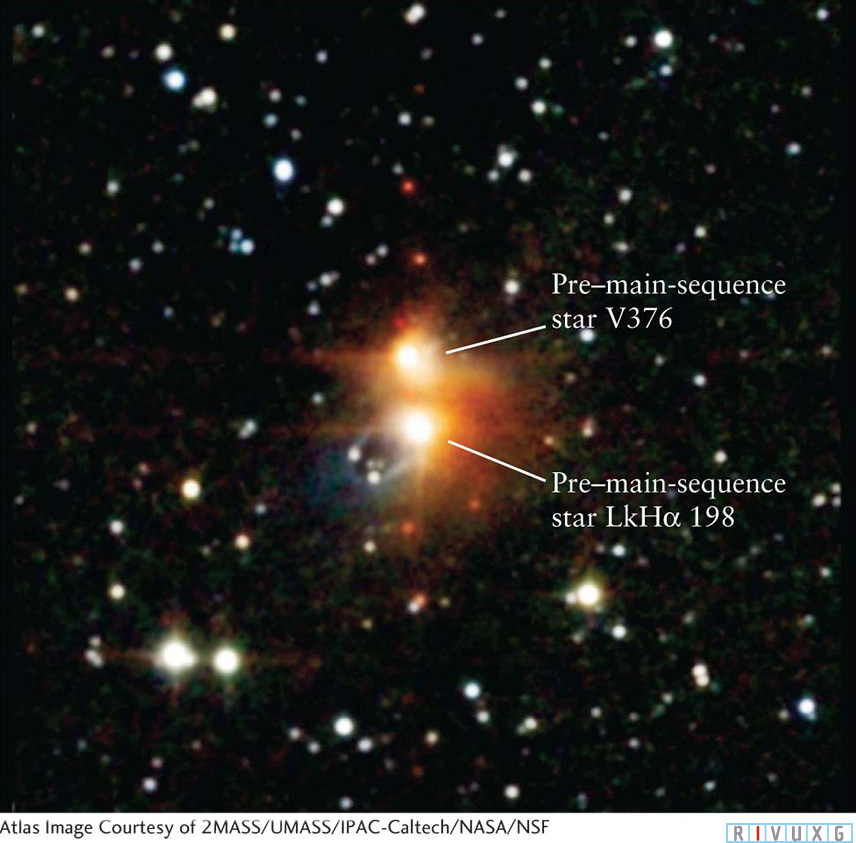
Figure 11-9:
Pre–Main-Sequence Stars Seen in infrared, the two large bright objects in the center of this image are pre–main-sequence stars. They have recently shed their cocoons of gas and dust but still have strong stellar winds that create their irregular shapes. The two stars are an optical double; that is, they are not orbiting each other.
11-4 The evolutionary track of a pre–main-sequence star depends on its mass
The more massive a pre–main-sequence star is, the more rapidly it begins hydrogen fusion in its core. For example, calculations indicate that a 5 M⊙ pre–main-sequence star starts fusing less than a million years after it first forms from a protostar, whereas a 1 M⊙ pre–main-sequence star takes a few tens of millions of years to begin fusion.
Calculations reveal that the minimum temperature required to start normal hydrogen fusion (see Discovery 9-1: Thermonuclear Fusion) in the core of a star is 10 million K. However, pre–main-sequence stars less massive than 0.08 M⊙ do not have enough gravitational force compressing and heating their cores to ever get this hot. As a result, these small bodies contract to become planetlike orbs of hydrogen and helium, called brown dwarfs (Figure 11-10). To date the lowest-mass star that has been observed has 0.091 M⊙. This star, part of a binary system, is only 95 times more massive and 16% larger than Jupiter.
Astrophysicists use computers and the equations of stellar structure (described in Section 9-8) to model the evolution of a pre–main-sequence star. By calculating changes in the energy that the contracting star emits, computer simulations can follow its changing position on a Hertzsprung-Russell (H-R) diagram (Figure 11-11). Keep in mind that such an evolutionary track represents changes in a star’s temperature and luminosity, not its motion in space.
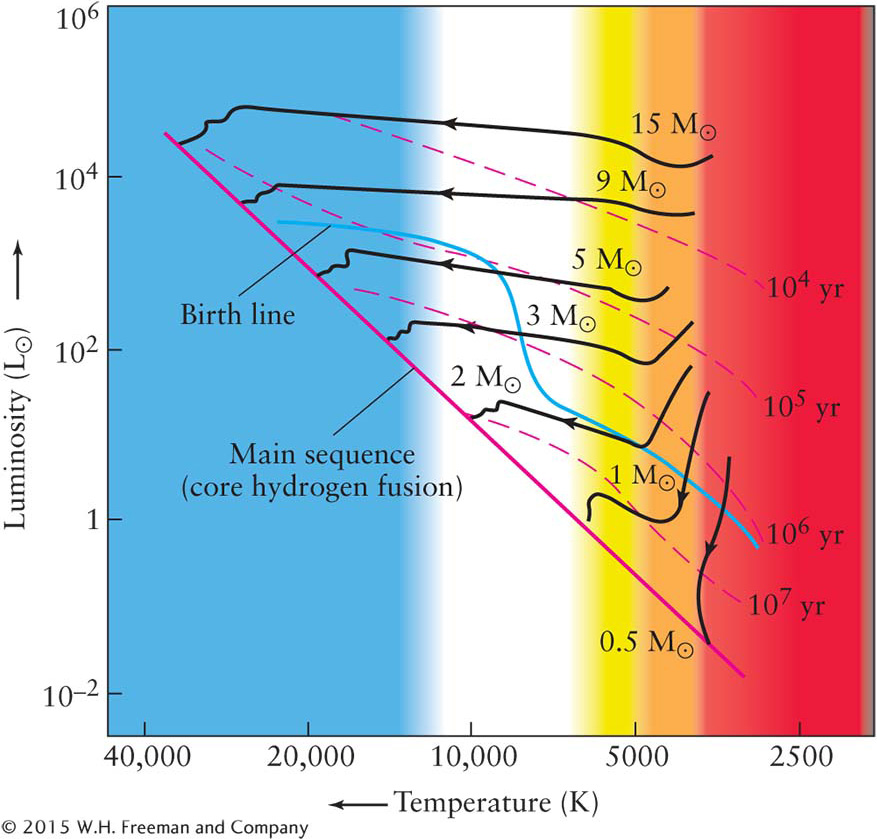
Figure 11-11: Pre–Main-Sequence Evolutionary Tracks This H-R diagram shows evolutionary tracks based on models of seven stars having different masses. The dashed lines indicate the stage reached after the indicated number of years of evolution. The birth line, shown in blue, is the location where each protostar stops accreting matter and becomes a pre– main-sequence star. Note that all tracks terminate on the main sequence at points that agree with the mass–luminosity relationship (see Figure 10-14a).
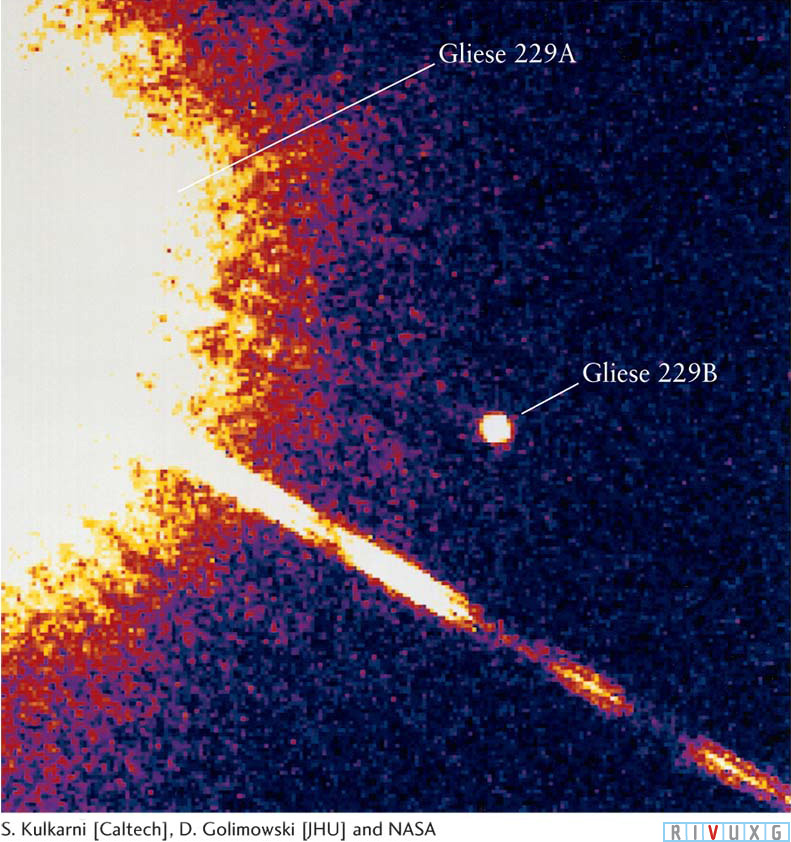
Figure 11-10:
A Brown Dwarf Located 18 light-years (6 pc) from Earth in the constellation Lepus (the Hare), Gliese 229B was the first confirmed brown dwarf ever observed. With a surface temperature of about 1000 K, its spectrum is similar to that of Jupiter. Gliese 229B is in orbit around a star. The overexposed image of part of its companion, Gliese 229A, appears on the left. The two bodies are separated by about 43 AU. Gliese 229B has from 20 to 50 times the mass of Jupiter, but the brown dwarf is compressed to the same size as Jupiter. The spike of light was produced when Gliese 229A overloaded part of the Hubble Space Telescope’s electronics.
Protostars transform into pre–main-sequence stars as they cross a curve called the birth line (see the blue line in Figure 11-11). A star’s exact location on this curve depends primarily on its mass and, to a much smaller extent, on the amount of metal it contains. (Recall from Section 10-6 that all elements other than hydrogen and helium are considered metals by astronomers.)
Spectroscopic observations of pre–main-sequence stars show many are vigorously ejecting gas, often in oppositely directed jets, just before they reach the main sequence. Gas-ejecting stars in spectral classes G and cooler (that is, G, K, and M) are called T Tauri stars (Figure 11-12a), after the first example discovered in the constellation of Taurus. Some astronomers propose that the onset of hydrogen fusion is preceded by vigorous chromospheric activity marked by enormous spicules (see Section 9-2) and flares (see Section 9-6) that propel the star’s outermost layers back into space. If the protostar from which the T Tauri star condenses has a surrounding disk of gas and dust, as our Sun once had (see Sections 4-2 and 11-2), then much of the gas ejected back into space leaves as two jets perpendicular to the plane of the disk. These jets slam into surrounding interstellar gas, causing it to glow, thereby creating Herbig-Haro objects (see Figure 11-12b).
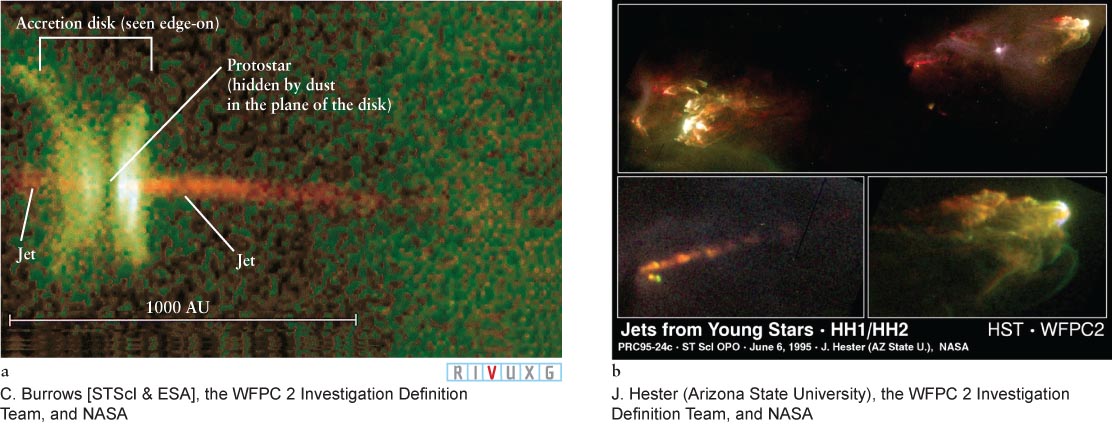
Figure 11-12:
T Tauri Star (a) Protostar HH 30 is emitting gas primarily as two opposed jets. Called a T Tauri star, it is not yet on the main sequence. The star is hidden inside a disk of gas and dust. (b) The Herbig Haro objects HH1/HH2. These two glowing regions are on opposite sides of a T Tauri object in the constellation Orion. The two outer edges of these objects are separated by about 1 light-year.
Focus Question 11-4
Which star arrives on the main sequence first, one that is 0.5 M⊙ or one that is 2 M⊙?
An infant star going through its T Tauri stage can lose as much as 0.4 M⊙ of matter and also shed its surrounding gas and dust while still a pre–main-sequence star. In light of all this activity, it is not surprising that observations reveal T Tauri stars to be variable, meaning that they change brightness much more than, say, the Sun does today. We will discuss variable stars further in Sections 11-12 and 11-13.
Focus Question 11-5
How are T Tauri stars different from main-sequence stars like the Sun?
Pre–main-sequence stars more massive than 2 M⊙ become hotter without much change in overall luminosity. The evolutionary tracks of these pre–main-sequence stars thus traverse the H-R diagram nearly horizontally, from right to left (see Figure 11-11). A star that is more massive than about 7 M⊙ has no pre–main-sequence phase at all. Its gravitational compression is so great that it begins to fuse hydrogen in its protostellar phase.
Until 2004, the upper limit to main-sequence stellar mass was thought to be around 120 M⊙. This number was based on calculations that show that above this mass, protostars rapidly develop extremely high fusion rates in their cores, which lead to extremely high surface temperatures—temperatures so great that their outer layers are superheated and thereby expelled into interstellar space. This expulsion, in turn, decreases their masses and their temperatures. An example of a very massive star in the process of shedding mass as it settles down onto the main sequence is the Pistol Star (Figure 11-13). One of the most luminous stars in our Galaxy, the Pistol Star may have started as a protostar with 200 M⊙. Observations reveal that every few thousand years it expels shells of gas, and it may have less than 10 M⊙ left when the expulsion of matter stops. The entire process of mass loss by very massive stars takes only a few million years.
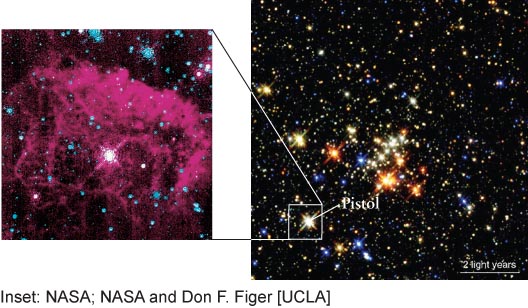
Figure 11-13: Mass Loss from a Supermassive Star The Quintuplet Cluster is 25,000 light-years from Earth. (Inset) Within the cluster is one of the brightest known stars, called the Pistol. Astronomers calculate that the Pistol formed nearly 3 million years ago and originally had 100–200 M⊙. The structure of the gas cloud suggests the star ejected the gas we see in two episodes, 6000 and 4000 years ago. The gas from any previous ejections is so thinly spread now that we cannot see it. The nebula shown in the inset is more than 4 ly (1.25 pc) across—it would stretch from the Sun nearly to the closest star, Proxima Centauri. The name Pistol was given to the star based on early, low-resolution radio images of its gas, which initially looked like an old-fashioned pistol aimed to the left near the top of the inset.
In 2004, however, astronomers observed a main-sequence star that apparently has between 130 and 150 M⊙. In 2006, they saw the remnants of a star that must have been at least 150 M⊙. In 2010, the star R136a1 was observed to have 265 M⊙. As it has been shedding mass for some time, calculations indicate that its original mass was 320 M⊙. Clearly, our understanding of star formation is very much a work in progress.
11-5 H II regions harbor young star clusters
We can detect young open clusters of stars from the magnificent glows they create in the nebulae in which they form. Figure 11-3 and Figure 11-14 show examples of these emission nebulae. Because these nebulae are predominantly ionized hydrogen, they are also called H II regions. To see why H II regions occur, remember that the most massive pre–main-sequence stars, those of spectral types O and B, are exceptionally hot. Their surface temperatures are typically 15,000 to 35,000 K, causing them to emit vast quantities of ultraviolet radiation. This energetic radiation easily ionizes any surrounding hydrogen gas, thereby creating an H II region. Photons from an O5 star can ionize hydrogen atoms up to 30 light-years away.
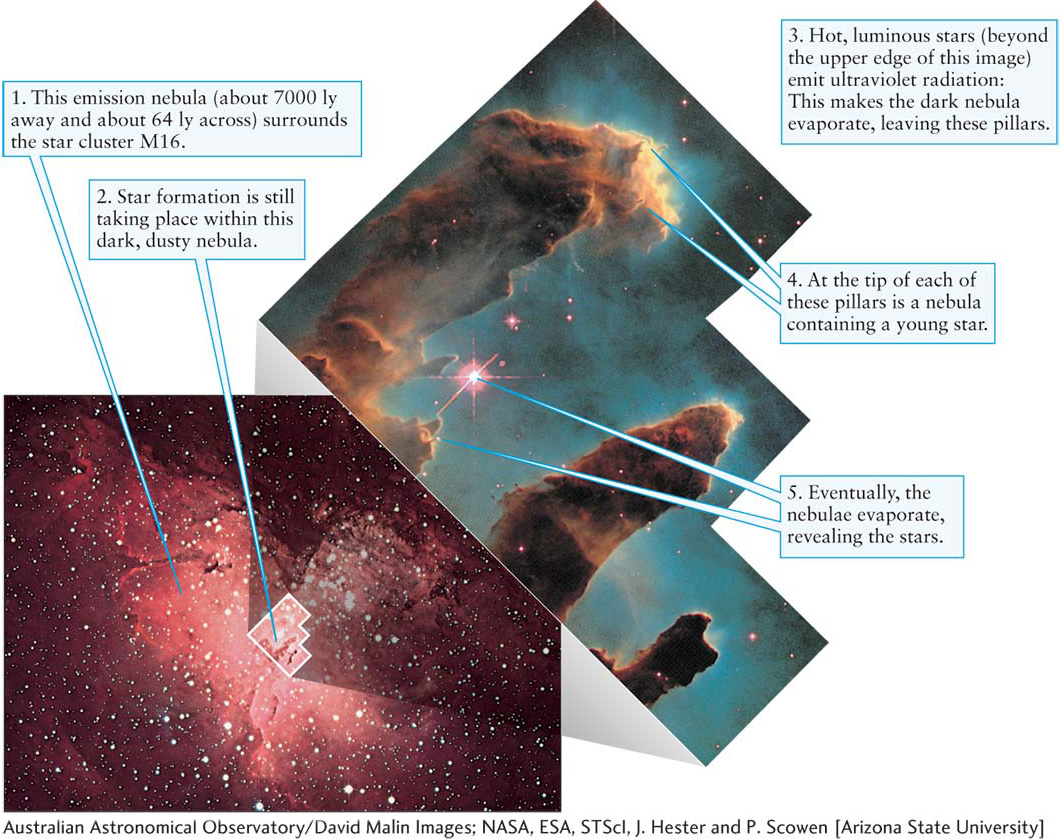
Figure 11-14: An H II Region This emission nebula, M16, called the Eagle Nebula because of its shape, surrounds a star cluster. It is so numbered because it was the sixteenth object in the Messier Catalogue of astronomical objects. Star formation is presently occurring in M16, which is located 7000 light-years from Earth in the constellation of Serpens Cauda (the Serpent’s Tail). Several bright, hot O and B stars are responsible for the ionizing radiation that causes the gases to glow. (Inset) Star formation is occurring inside these dark pillars of gas and dust. Intense ultraviolet radiation from existing massive stars off to the right of this image is evaporating the dense cores in the pillars, thereby prematurely terminating star formation there. Newly revealed stars are visible at the tips of the columns.
H II denotes ionized hydrogen, which has no electrons in orbit that can make transitions and give off or absorb photons; therefore, how can we observe it? While some hydrogen atoms in the H II regions are being knocked apart by ultraviolet photons, some of the free protons and electrons approach each other so closely that they combine to become short-lived neutral hydrogen, H I atoms (which are soon re-ionized by ultraviolet radiation). As these new hydrogen atoms assemble, their electrons return to their ground states (n = 1). This downward cascade through each atom’s energy levels, releasing photons with each jump between levels, is what makes the nebula glow. Particularly prominent is the transition from n = 3 to n = 2, which produces Hα photons at 656 nm in the red portion of the visible spectrum (review the emission line spectrum in Figure 3-48c and d). Thus, the nebula around a newborn star cluster often shines with a distinctive reddish hue (see Figure 11-14). Nebulae that have oxygen often look green when seen with the eye through a telescope because this gas has a green emission line at 501 nm. Because the eye is more sensitive to green light than red, the dimmer oxygen emission line appears brighter in our brains than does the Hα line, which shows up well on CCD images, causing these lines to appear red.
An H II region is a small, bright “hot spot” in a giant molecular cloud. The collection of hot, bright O and B stars that produces the ionizing ultraviolet radiation is called an OB association. The famous Orion Nebula (Figure 11-15; see also Figure 1-4 and Figure 11-1) is an example. Four O and B stars in an open cluster called the Trapezium, at the heart of the Orion Nebula, are the primary sources of the ionizing radiation that causes the surrounding gases to glow. The Orion Nebula is embedded in a giant molecular cloud whose mass is estimated at 500,000 M⊙.
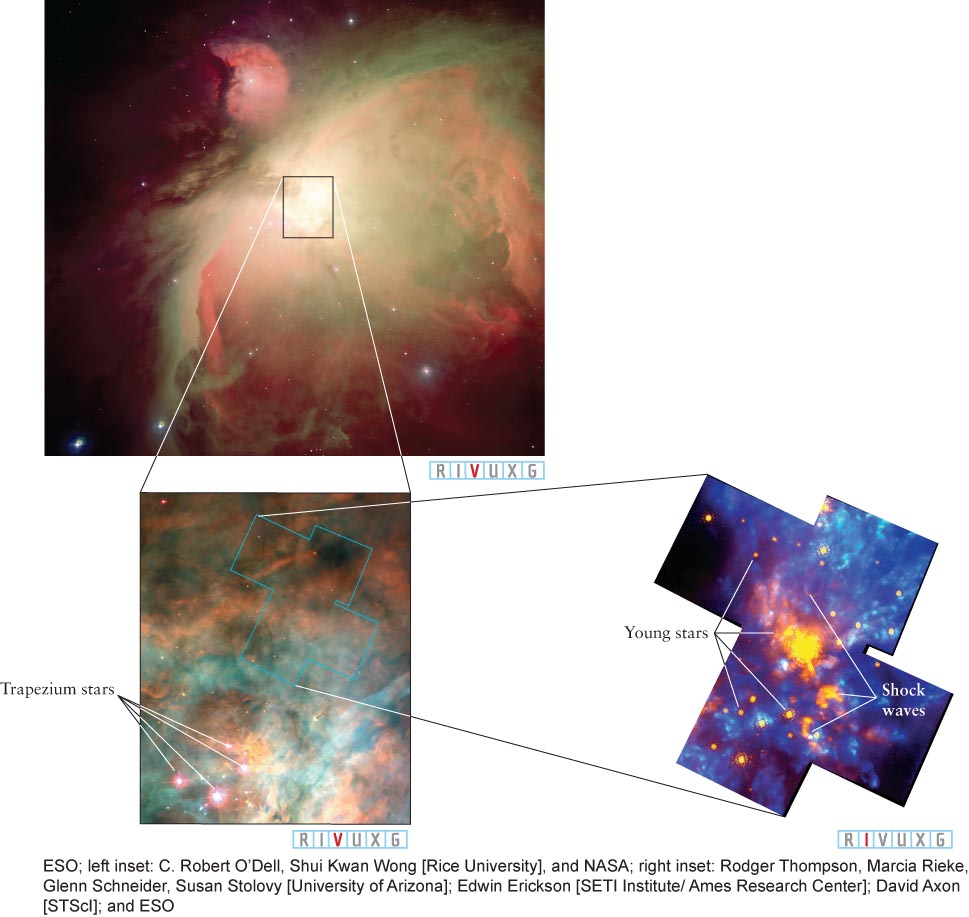
Figure 11-15:
The Orion Nebula The middle “star” in Orion’s sword is actually the Orion Nebula, part of a huge system of interstellar gas and dust in which new stars are now forming. The Orion Nebula is a region visible to the naked eye. It is 1600 ly (490 pc) from Earth and has a diameter of roughly 16 ly (5 pc). This nebula’s mass is about 300 M⊙. (Left inset) This view at visible wavelengths shows the inner regions of the Orion Nebula. At the lower left are four massive stars, the brightest members of the Trapezium star cluster, which cause the nebula to glow. (Right inset) This view shows that infrared radiation penetrates interstellar dust that absorbs visible photons. Numerous infrared objects, many of which are stars in the early stages of formation, can be seen, along with shock waves caused by matter flowing out of protostars faster than the speed of sound waves in the nebula. Shock waves from the Trapezium stars may have helped trigger the formation of the protostars in this view.
The OB association that creates an H II region also affects the rest of the giant molecular cloud in which it is embedded (see Figure 11-15 insets). Detailed models indicate that vigorous stellar winds, along with ionizing ultraviolet radiation from these stars, carve out a cavity in the cloud. Where this outflow is supersonic, it creates a shock wave, like the sonic boom created when a whip is snapped (for example, see the shock waves shown in the right inset of Figure 11-15). The shock wave forms along the outer edge of the expanding H II region, compressing hydrogen gas as it passes and thereby stimulating a new round of star birth. As more O and B stars form, they power the expansion of the H II region still farther into the giant molecular cloud. Meanwhile, the older O and B stars left behind begin to disperse (Figure 11-16). In this way, an OB association “eats into” a giant molecular cloud, creating stars in its wake. The inset in Figure 11-16 shows star formation around a single O star.
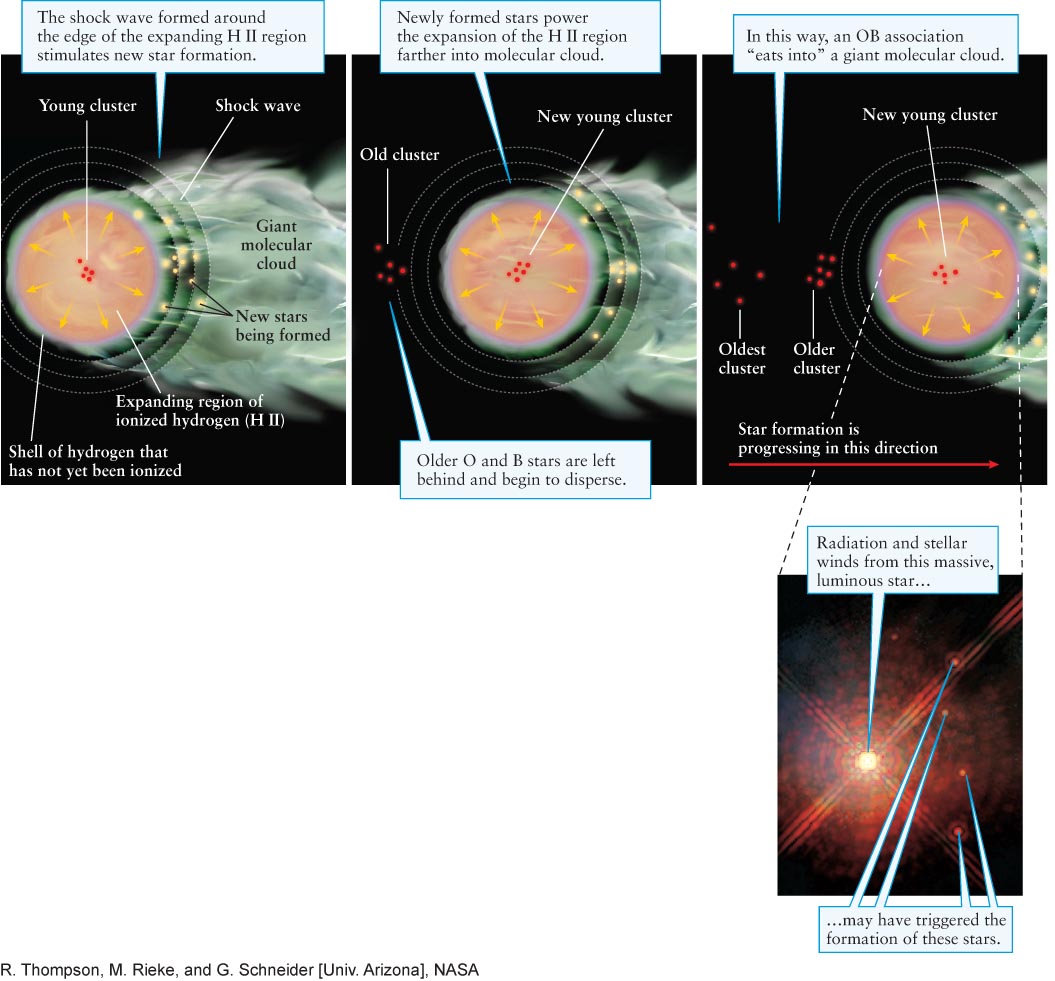
Figure 11-16: The Evolution of an OB Association High-speed particles and ultraviolet radiation from young O and B stars produce a shock wave that compresses gas farther into the molecular cloud, stimulating new star formation deeper in the cloud. Meanwhile, older stars are left behind. (Inset) Stars forming around a massive star 2500 ly (770 pc) away in the constellation Monoceros’s Cone Nebula. The stars (small dots on the right side of the inset) arrayed around the bright, massive central star are believed to have formed as a result of the central star compressing surrounding gas with high-speed particles and radiation. The younger stars are just 0.04–0.08 light-years from the central star.
11-6 Plotting a star cluster on an H-R diagram reveals its age
As noted in Section 11-2, stars are often observed to form in open clusters, such as seen in the nearby Orion Nebula (see Figure 11-15). Numerous other star-forming regions have been identified, and the young open clusters in them offer astronomers a rich source of information about stars in their infancy. By measuring each star’s apparent magnitude, color, and distance, an astronomer can deduce its luminosity and surface temperature. The data for all the stars in the cluster can then be plotted on an H-R diagram, as shown for the Pleiades in Figure 11-2 or for the cluster NGC 2264 in Figure 11-17.
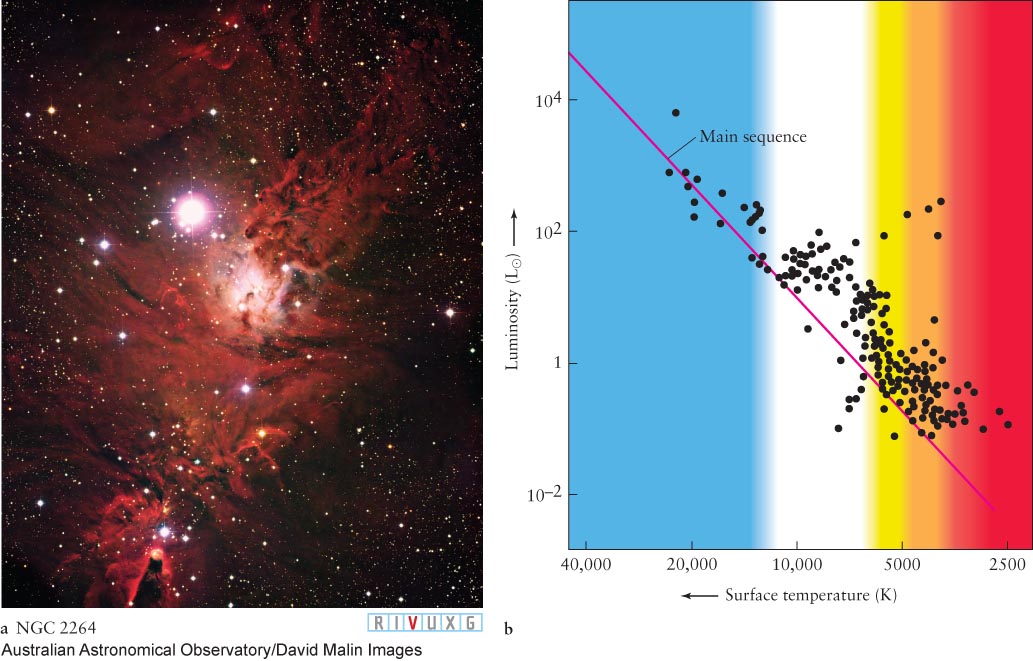
Figure 11-17:
Plotting the Ages of Stars (a) This photograph shows a region of ionized hydrogen and the young star cluster NGC 2264 in the constellation Monoceros. The red nebulosity is located about 2600 light-years from Earth and contains numerous stars that are about to begin hydrogen fusion in their cores. (b) Each dot plotted on this H-R diagram represents a star in this cluster whose luminosity and surface temperature have been measured. Note that most of the cool, low-mass stars have not yet arrived at the main sequence. Calculations of stellar evolution indicate that this star cluster started forming about 2 million years ago.
Because all of the stars in a cluster begin forming at the same time, and stars with different masses arrive on the main sequence at different times, astronomers can use the H-R diagram to determine the age of a cluster. For example, note that the hottest stars in NGC 2264 lie on the main sequence. These hot stars have surface temperatures around 20,000 K and are extremely bright and massive. Their radiation also causes the surrounding gases to glow. Most of the stars cooler than about 10,000 K have not yet arrived at the main sequence. These less massive stars, which are in the final stages of pre–main-sequence contraction, are just now beginning to ignite thermonuclear reactions at their centers.
Focus Question 11-6
What are groups of high-mass stars called?
From the H-R diagram of a young cluster we can see which are the lowest-mass stars that have already entered the main sequence. Using this information, along with theories of stellar evolution, we can determine the cluster’s age. The cluster NGC 2264, for example, is roughly 2 million years old. In contrast, nearly all of the stars in the Pleiades (see Figure 11-2b) have completed their pre–main-sequence stage. That cluster’s age is calculated to be about 100 million years, which is how long it takes for the least massive stars to finally begin hydrogen fusion in their cores.
Open clusters dissipate. As noted earlier, open clusters, such as the Pleiades and NGC 2264, possess barely enough mass to hold themselves together. A star moving faster than the average speed for the cluster occasionally escapes. This lowers the total gravitational force of the cluster, making it easier for other stars to leave. Observations indicate that the stars in most open clusters separate from each other and eventually mix with the rest of the stars in the Galaxy within 10–50 million years after the cluster began forming, although some open clusters last for a few hundred million years.