13-14 Galaxies exist in clusters that may form still larger clumps called superclusters
 Galaxies are not scattered randomly throughout the universe, but rather they are grouped together in clusters. The Hercules cluster (Figure 13-34), so called because it is located in the constellation of Hercules, is typical. Observations of galactic motion indicate that members of a cluster of galaxies are gravitationally bound together: The galaxies in a cluster orbit each other and, occasionally, even collide. Calculations based on observations of the Andromeda Galaxy’s velocity strongly suggest that it and our Milky Way will collide in 4 billion years.
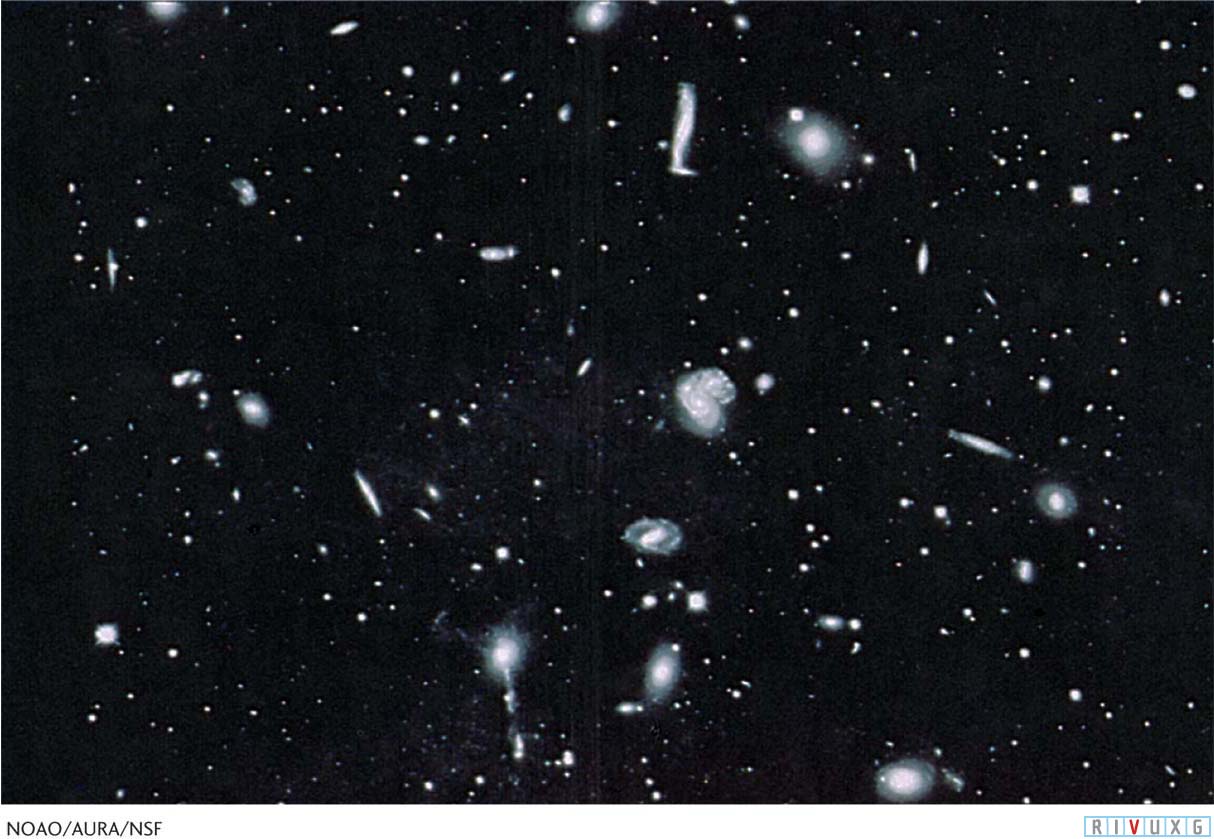
Figure 13-34:  A Cluster of Galaxies This group of galaxies, called the Hercules cluster, is about 650 million light-years from Earth. Both elliptical and spiral galaxies within this cluster can be easily identified.
Clusters of galaxies are themselves grouped together in huge associations called superclusters. A typical supercluster contains dozens of individual clusters spread over a volume typically 150 million light-years across. Figure 13-35 shows the distribution of superclusters in our vicinity of the universe. The Milky Way, along with the rest of the Local Group of galaxies, are members of the Laniakea Supercluster, identified in 2014. Laniakea is Hawaiian for ‘immeasurable heaven.’ The structure of this supercluster is still under investigation. Observations indicate that most superclusters are not gravitationally bound units—most clusters in each supercluster are drifting away from most of the other clusters in that same supercluster. Furthermore, the superclusters are all moving away from one another.
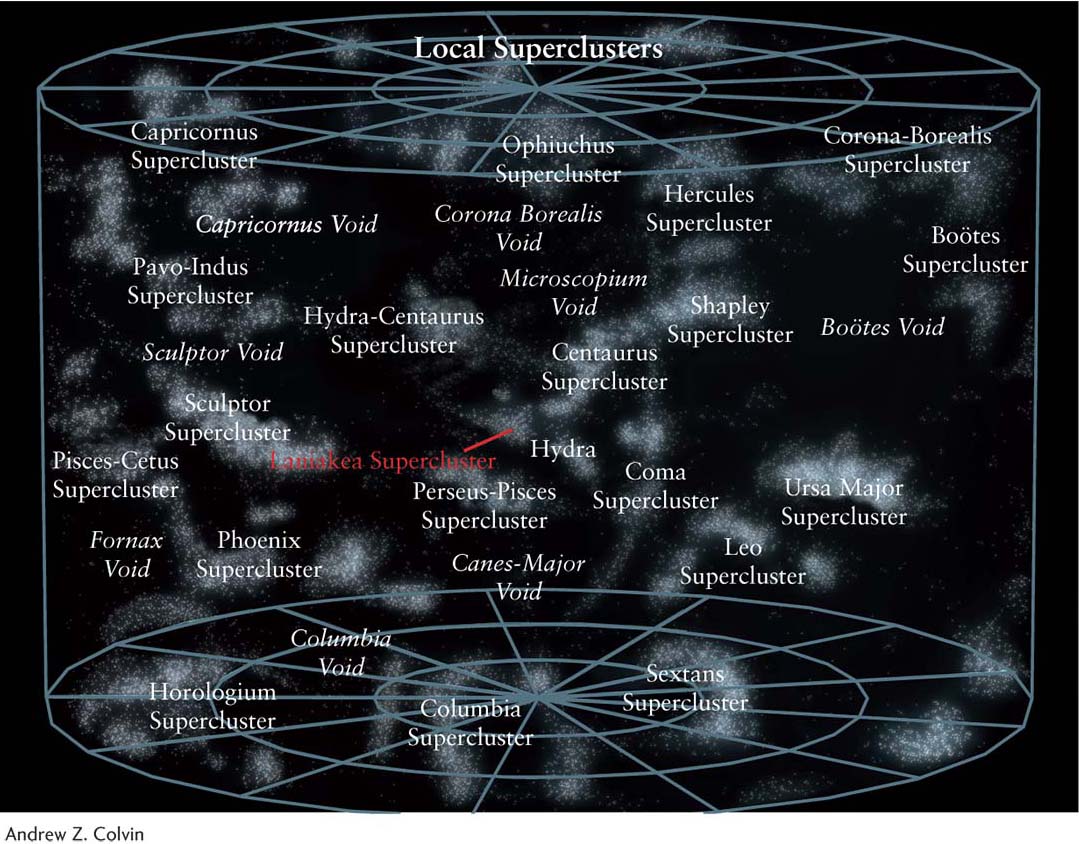
Figure 13-35: Superclusters in Our Neighborhood This diagram shows the distances and relative positions of superclusters within 950 million light-years of Earth. Note also the labeling of some of the voids, which are large, relatively empty regions between superclusters.
The distribution of superclusters appears to have the structure of a spongeHow superclusters are distributed in space started to become clearer in the early 1980s, when astronomers began systematic surveys of the positions of observable objects in the nearby universe. Completed in 2005, the first Sloan Digital Sky Survey observed nearly 200 million galaxies, stars, and other celestial objects and measured the redshifts of more than a million of them. This survey, made in the northern hemisphere, covered about one-quarter of the sky and gives us a three-dimensional map of 100 times the volume of space as we had mapped before. Another set of observations, called the Two Degree Field (2dF) Survey, studied regions of both the northern and southern hemispheres.
These data reveal that most superclusters are located on the boundaries between enormous bubblelike voids in which few galaxies are observed (Figure 13-35 and Figure 13-36). These voids are roughly spherical and typically measure between 100 million and 400 million light-years in diameter. They are not completely empty, however. Observations reveal hydrogen clouds in some of them, while others may be subdivided by strings of dim galaxies.

Figure 13-36: Structure in the Universe This map shows the distribution of 62,559 galaxies in two wedges extending in opposite directions from Earth out to distances of 3.25 Bly (billion light-years). For an explanation of right ascension (R.A.), see Section 1-3. Note the prominent voids surrounded by thin areas full of galaxies.
Focus Question 13-11
Astronomers observe very hot (107 K) gas between clusters of galaxies. Why does this gas not appear in Figure 13-34?
The distribution of clusters of galaxies throughout the universe appears to have the structure of a sponge (Figure 13-37) or soap bubbles, with the galaxies located where the sponge or soapy material is, surrounded by voids. Astronomers believe that this spongy pattern contains important clues about conditions in the early universe that have not yet been fully fathomed.
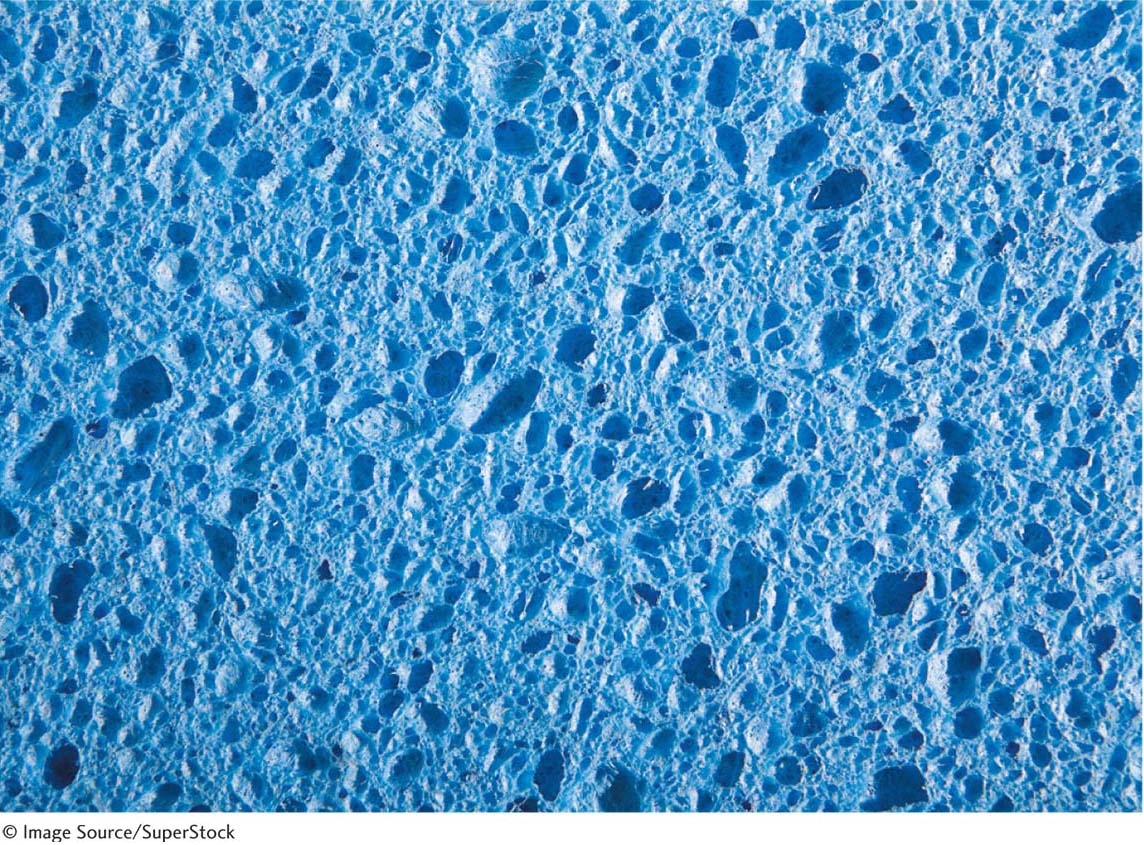
Figure 13-37: Foamy Structure of the Universe A sponge structure recreates the distribution of bright clusters of galaxies throughout the universe. The empty spaces in the foam are analogous to the voids found throughout the universe. The spongy regions are analogous to the locations of most of the superclusters of galaxies.
Clusters of galaxies may appear densely or sparsely populated and regular or irregular in shapeA cluster of galaxies is said to be either a poor cluster or a rich cluster, depending on whether it contains less than or more than a thousand galaxies. For example, the Milky Way Galaxy, the Andromeda Galaxy, and the Large and Small Magellanic Clouds belong to a poor cluster called the Local Group. The Local Group contains roughly 40 galaxies, over a third of which are dwarf ellipticals. Figure 13-38 shows a map covering most of the Local Group. The Virgo cluster is the nearest rich cluster, with more than 2000 galaxies.
Galaxies in the Local Group continue to be found. These discoveries happen primarily because astronomers are developing techniques to observe objects that lie in the same plane as, but beyond, the Milky Way. In addition to the 1994 discovery of the Sagittarius Dwarf Galaxy, the dwarf galaxy Antlia (Figure 13-39) was first observed in 1997 and the Canis Major Dwarf (see Figure 13-16) was found in 2003. The Canis Major Dwarf is only about 25,000 light-years from the Milky Way, which is closer to us than we are to the center of our Galaxy.
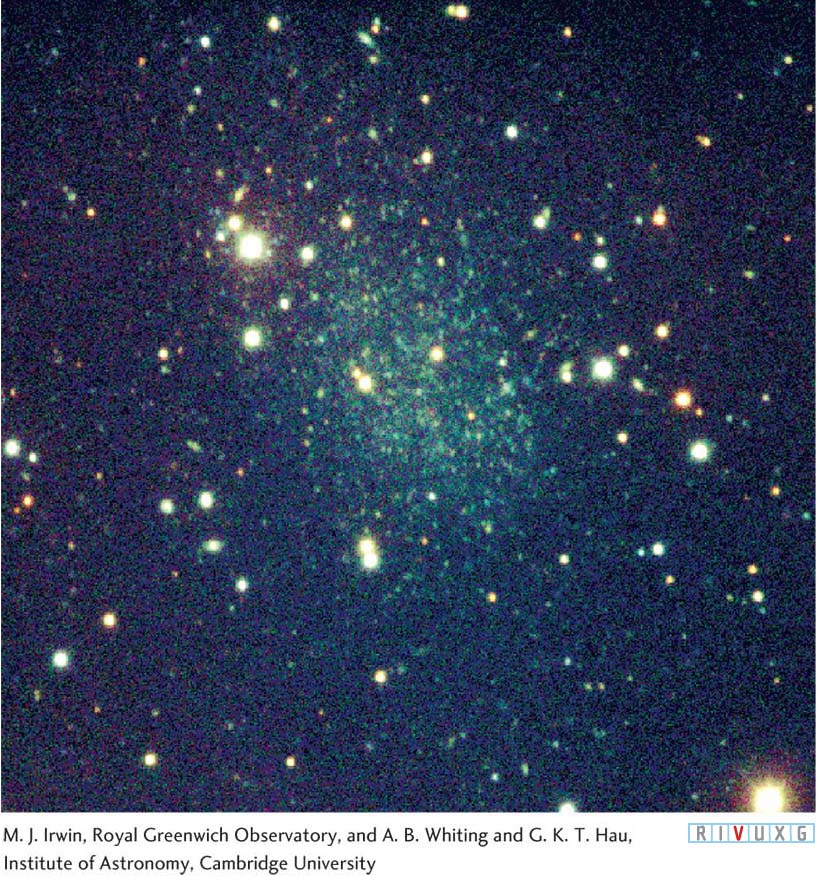
Figure 13-39:
A Recently Discovered Member of the Local Group The galaxy Antlia was first detected in 1997. It lies about 3 million light-years away, outside the region depicted in Figure 13-38. This galaxy contains only about a million stars.
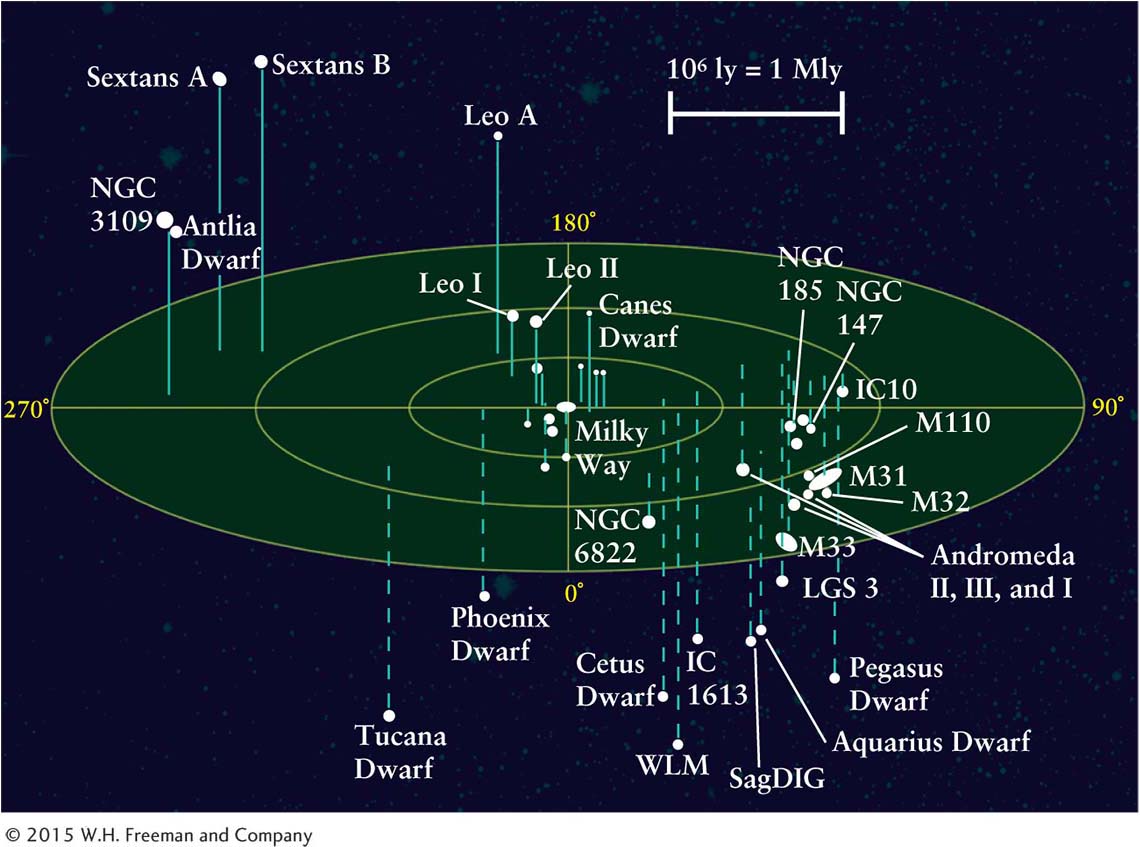
Figure 13-38: The Local Group Our Galaxy belongs to a poor, irregular cluster that consists of about 40 galaxies, called the Local Group. This map shows the distribution of about three-quarters of the galaxies. The Milky Way and Andromeda galaxies are the largest and most massive galaxies in the Local Group. Andromeda (M31) and the Milky Way are each surrounded by a dozen satellite galaxies. The recently discovered Canes Dwarf Galaxy is the Milky Way’s nearest known neighbor.
Focus Question 13-12
What are two reasons that new galaxies are still being discovered in the Local Group?
Astronomers also categorize clusters of galaxies according to their shapes. A regular cluster is distinctly spherical with a marked concentration of galaxies at its center. Numerous gravitational interactions over billions of years have spread the galaxies into this distribution. In contrast, galaxies in an irregular cluster are more randomly scattered about a sprawling region of the sky. The local group and the Virgo cluster are irregular.
The nearest example of a rich, regular cluster is the Coma cluster, located about 300 million light-years from us in the constellation of Coma Berenices (Figure 13-40). Despite its great distance, more than 1000 bright galaxies within it can be detected with our current telescopes.
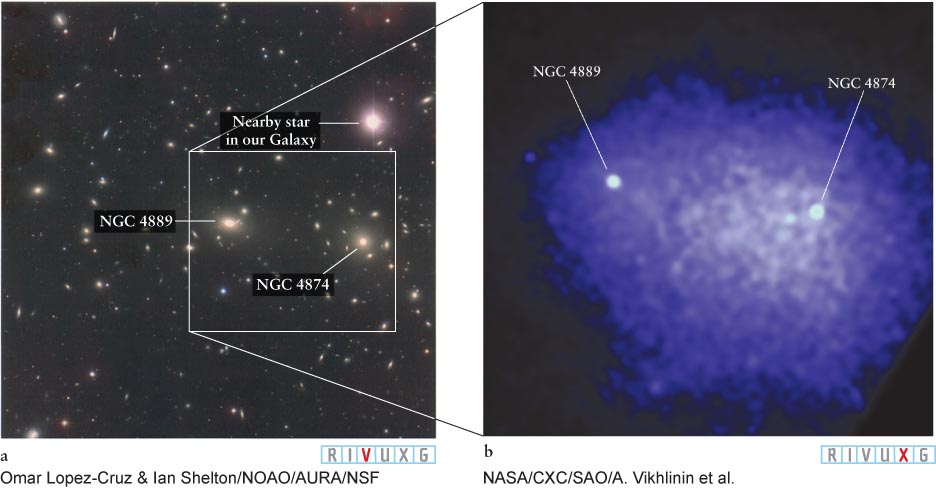
Figure 13-40:
 The Coma Cluster (a) This rich, regular cluster, containing thousands of galaxies, is about 300 million light-years from Earth. Only the inner region of the cluster is shown here. (b) Regular clusters are composed mostly of elliptical and lenticular galaxies and are sources of X-rays. This Chandra image shows Coma’s central region, which is 1.5 million light-years across. The gas cloud emitting most of these X-rays has a temperature of 100 million K.
Rich, regular clusters, like the Coma cluster, contain mostly elliptical and lenticular galaxies. Only 15% of the Coma cluster’s presently known galaxies are spirals and irregulars. It is likely that the Coma cluster contains many thousands of as yet undetected dwarf ellipticals—maybe as many as 10,000 galaxies overall.
Irregular clusters, such as the Virgo cluster and the Hercules cluster (see Figure 13-34), display a more even mixture of galaxy types. While two-thirds of the 200 brightest galaxies in the Hercules cluster are spirals, nearly a fifth are ellipticals, and the rest are irregular.
13-15 Galaxies in a cluster can collide and combine
As noted earlier, two or more galaxies in a cluster or two or more galaxies from neighboring clusters occasionally collide. Sometimes these galaxies pass through one another (Figure 13-41) and sometimes they merge. There is so much space between stars that the probability of two stars crashing into each other during galactic collisions is extremely small. On the other hand, the galaxies’ huge clouds of interstellar gas and dust are so large that they do collide, slamming into each other and producing strong shock waves. The colliding interstellar clouds are stopped in their tracks.
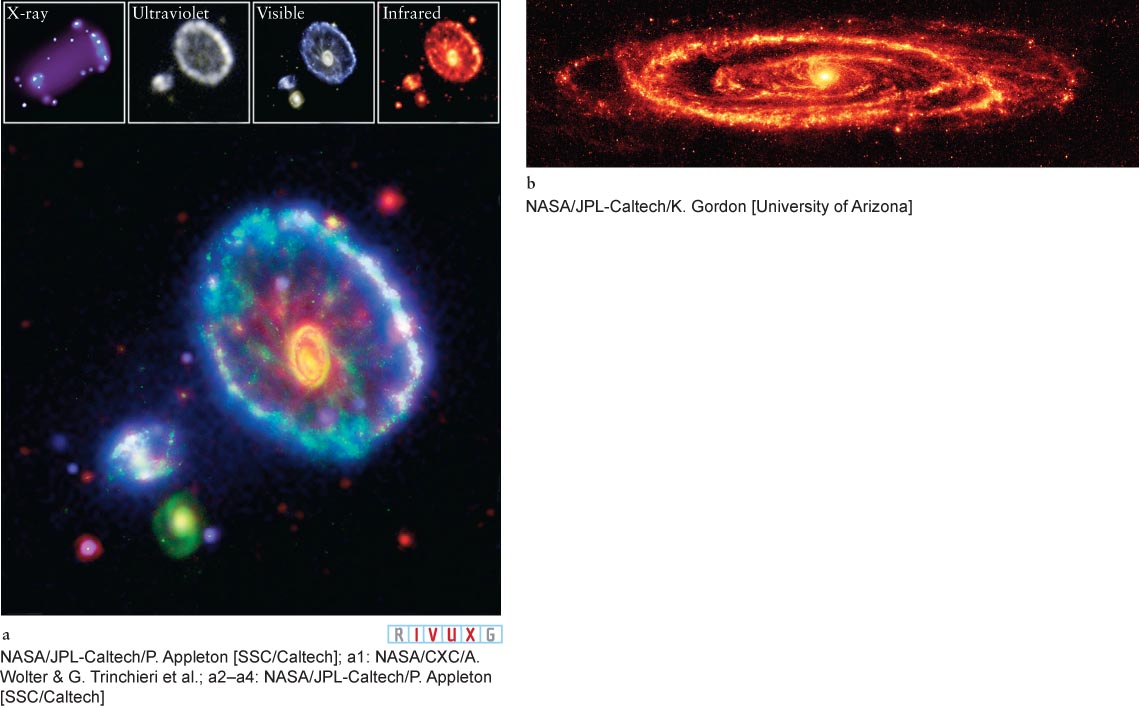
Figure 13-41: 
 Galaxies with Rings (a) A composite image of the Cartwheel Galaxy. This ring-shaped assemblage 500 million light-years from Earth is likely the result of one galaxy, probably the blue-white one below it at the eight o’clock position, having passed through the middle of the larger one. Astronomers suspect that the passage created a circular density wave in the Cartwheel, analogous to the ripple created by a rock thrown in a pond. This wave stimulated a burst of star formation, creating many bright blue and white stars. Ultraviolet is in blue, visible light in green, infrared in red, and X-ray in violet. (b) Infrared image of the Andromeda Galaxy. The ring of hot dust indicates star formation, probably caused by the passage of another galaxy through Andromeda. The fact that the ring is disturbed suggests that yet another galaxy had a close interaction with Andromeda.
A violent collision can strip both galaxies of their interstellar gas and dust. This happens because the stars in the two galaxies pass by each other and emerge as two separate galaxies, but the gas and dust from the two galaxies collide and stop each other. As a result, the gas and dust remain at the collision site as the stars depart. The energy associated with the collision heats this gas and dust to extremely high temperatures. This process is a major source of the hot intergalactic gas often observed in rich, regular clusters. The Chandra X-ray Observatory has observed intergalactic gas with temperatures between 300,000 and 100 million K.
Another source of intergalactic gas is gas escaping from dwarf galaxies. This gas is ejected by supernovae of stars created in a burst of star formation when these galaxies formed. Whereas our Galaxy’s gravitational force traps supernova remnants in the disk, this gas escapes into intergalactic space from the relatively weak gravitational attraction of dwarf galaxies.
Less violent collisions and near misses between galaxies allow the compressed interstellar gas and dust to cool sufficiently to have new stars form from it. These collisions can also stimulate galaxywide star formation, which may account for the starburst galaxies that blaze with the light of numerous newborn stars. These galaxies are characterized by bright centers surrounded by clouds of warm interstellar dust, indicating a recent, vigorous episode of star birth (Figure 13-42). Their warm dust is so abundant that starburst galaxies are among the most luminous objects in the universe at infrared wavelengths.
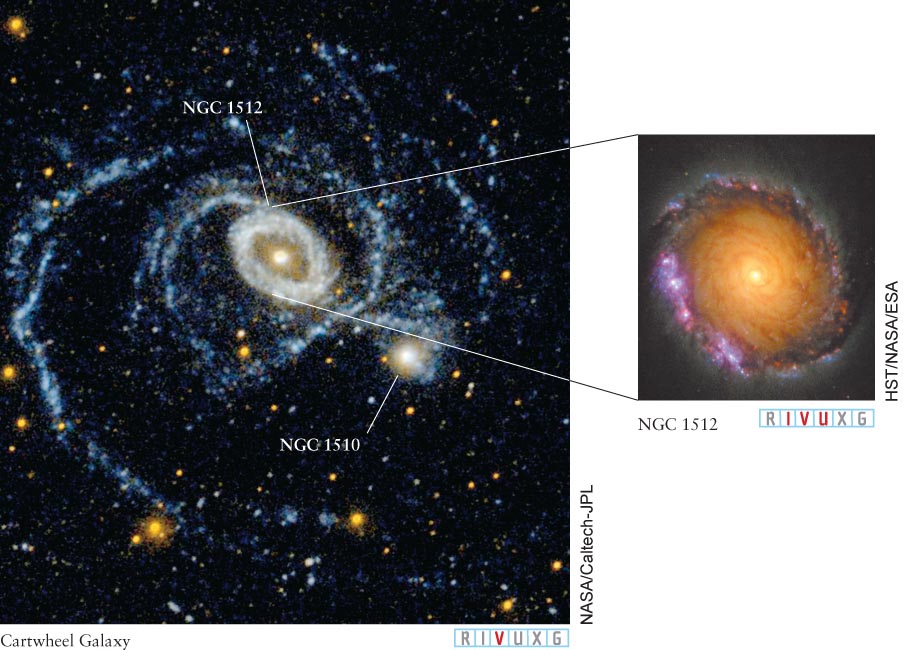
Figure 13-42:
 A Starburst Galaxy NGC 1512, located 30 Mly away in the constellation Horologium, is 70,000 ly across. Inset: A ring of vigorous star formation 2400 light-years wide highlights this ultraviolet, visible-light, and infrared composite image of the core of this galaxy. NGC 1512 may have recently passed close to its companion NGC 1510, thereby stimulating the starburst. Such rings of star formation are common in starburst galaxies.
Observational evidence indicates that globular clusters are formed during collisions of interstellar gas and dust. While most globular clusters are over 10 billion years old, some galaxies also contain very young clusters and, like the Milky Way, have some very dense star-forming regions that are believed to be precursors of new globular clusters. Whether those in our Galaxy formed as a result of an early collision of the Milky Way with another galaxy has yet to be determined.
The Irr II starburst galaxy M82 is one member of a nearby cluster of about a dozen galaxies that include the beautiful spiral galaxy M81 and a fainter companion, called NGC 3077 (Figure 13-43a). A radio survey of that region of the sky revealed enormous streams of hydrogen gas connecting these and other, smaller galaxies in that cluster (Figure 13-43b). The loops and twists in these streamers suggest that the three galaxies have had several close encounters over the ages, most recently about 600 million years ago.
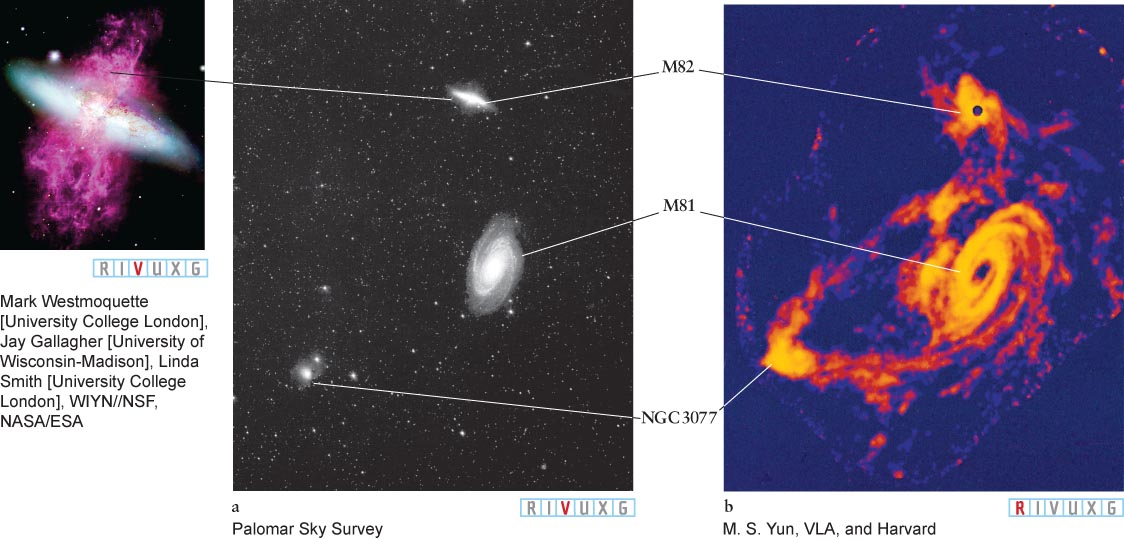
Figure 13-43:
 The M81 Group The Irr II starburst galaxy M82 is in a nearby cluster of about a dozen galaxies, including the spectacular spiral M81. Several of the galaxies in this cluster are connected by streamers of hydrogen gas. (a) The three brightest galaxies in the cluster at visual wavelengths. The inset on the left shows large volumes of hydrogen gas, in red, being ejected from M82. (b) This radio image, created from data taken by the Very Large Array, shows the streamers of hydrogen gas that connect the bright galaxies and also several dim ones, seen as regions of bright orange here.
Gravitational interactions between colliding galaxies can also result in millions of stars being hurled out into intergalactic space along huge, arching streams, as seen in Figure 13-44a. In rich clusters, astronomers also observe near misses between galaxies (Figure 13-44b). If galaxies are surrounded by extended halos of dim stars, these near misses strip the galaxies of these outlying stars. In this way, a loosely dispersed sea of dim stars populates the space between galaxies in a cluster.
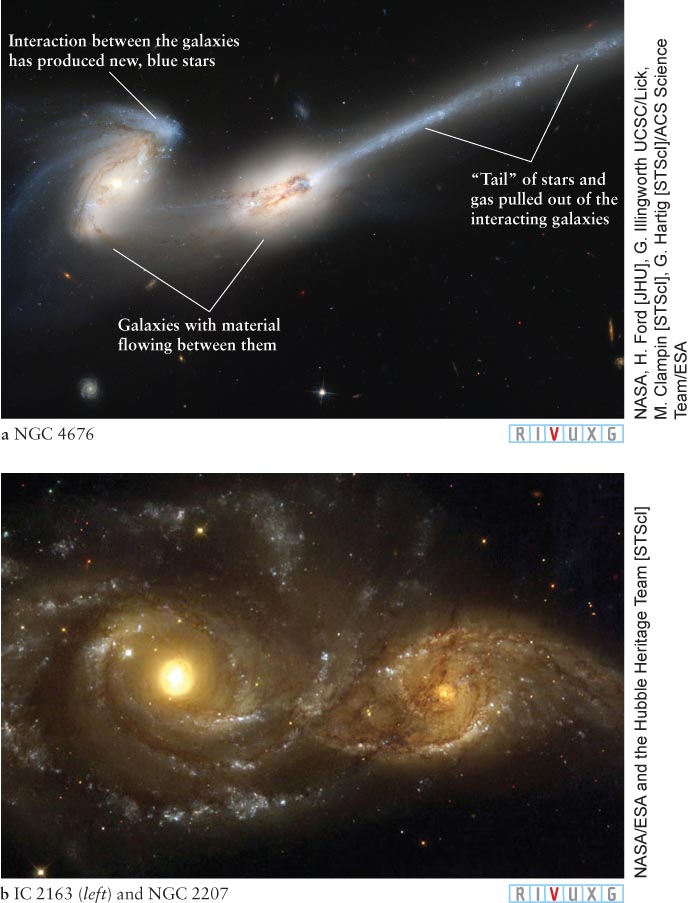
Figure 13-44:
Interacting and Colliding Galaxies (a) Pairs of colliding galaxies often exhibit long “antennae” of stars ejected by the collision. This particular system is known as NGC 4676 or “the Mice” (because of its tails of stars and gas). It is 300 million light-years from Earth in the constellation Coma Berenices. The collision has stimulated a firestorm of new star formation, as can be seen in the bright blue regions. Mass can also be seen flowing between the two galaxies, which will eventually merge. (b) These two galaxies, NGC 2207 (right) and IC 2163, are orbiting and tidally distorting each other. Their most recent close encounter occurred 40 million years ago when the two were perpendicular to each other and about 1 galactic diameter apart. Computer simulations indicate that they should eventually coalesce.
Similarly, after galaxies collide, some interior stars are flung far and wide, scattering material into intergalactic space. Such isolated stars have been observed by the Hubble Space Telescope. However, other stars slow down, often causing the remnants of the galaxies to merge. Several dramatic examples of galactic mergers have been discovered, such as the galaxy known as NGC 6240 (Figure 13-45). The supermassive black holes in the nuclei of the original two galaxies (see Section 12-15) have not yet merged (see Figure 13-45 inset) but are expected to do so within a few hundred million years. A pair of supermassive black holes was also observed in the nuclear region of the spiral galaxy NGC 3393, located some 160 Mly from Earth. They are also believed to be from the merger of two galaxies into one over a billion years ago.
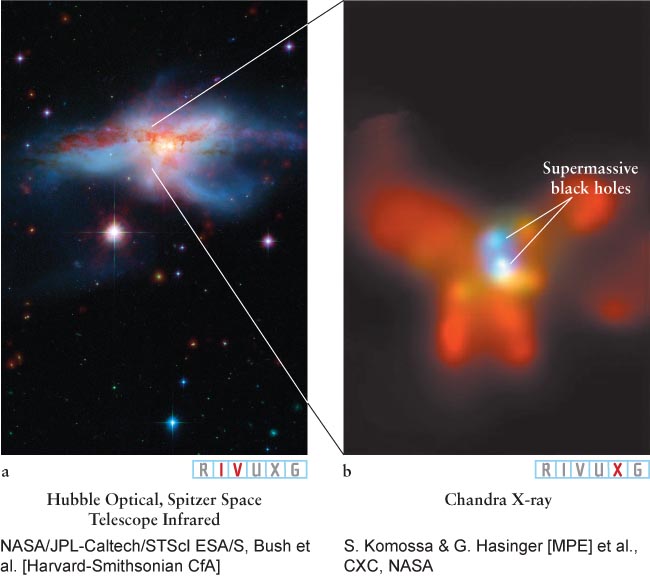
Figure 13-45:
Merging Galaxies This object, NGC 6240, in the constellation Ophi-uchus, is the result of two spiral galaxies in the process of merging. The widespread blue-green area reveals that the collision between the two galaxies has triggered an immense burst of star formation. Inset: The Chandra X-ray Observatory shows that at the heart of this system are two supermassive black holes, one from each of the original galaxies. Within a few hundred million years, these black holes are expected to merge into a single more massive black hole.
As mentioned in Section 13-5 with regard to the Milky Way tearing apart the Canis Major Dwarf Galaxy, astronomers speak of galactic cannibalism when a large galaxy captures and “devours” a smaller one. Cannibalism differs from mergers in that the “dining” galaxy is significantly bigger than its “dinner,” whereas merging galaxies are about the same size.
Many astronomers suspect that giant ellipticals are the product of galactic mergers and cannibalism, including spiral–spiral collisions. Observations reveal that giant galaxies typically occupy the centers of rich clusters. Once formed, giant ellipticals can continue to grow because smaller galaxies are often located around them (see Figure 13-29). As they pass through the extended halo of a giant elliptical, these smaller galaxies slow down and are eventually cannibalized by the larger galaxy.
Figure 13-46, a computer simulation, shows a large, disk-shaped galaxy devouring a small satellite galaxy. The large galaxy consists of 90% stars (blue) and 10% gas (white) by mass. It is surrounded by a halo of dark matter whose mass is about 3.3 times that of the disk. The satellite galaxy, which has a tenth of the mass of the large galaxy, contains only stars (yellow). Initially, the satellite is in circular orbit about the large galaxy. Note that spiral arms appear in the large galaxy as the collision proceeds. Two billion years elapse as the satellite spirals in toward the core of the large galaxy. Although much material is stripped from the satellite, most of its stars plunge into the central region of the large galaxy.
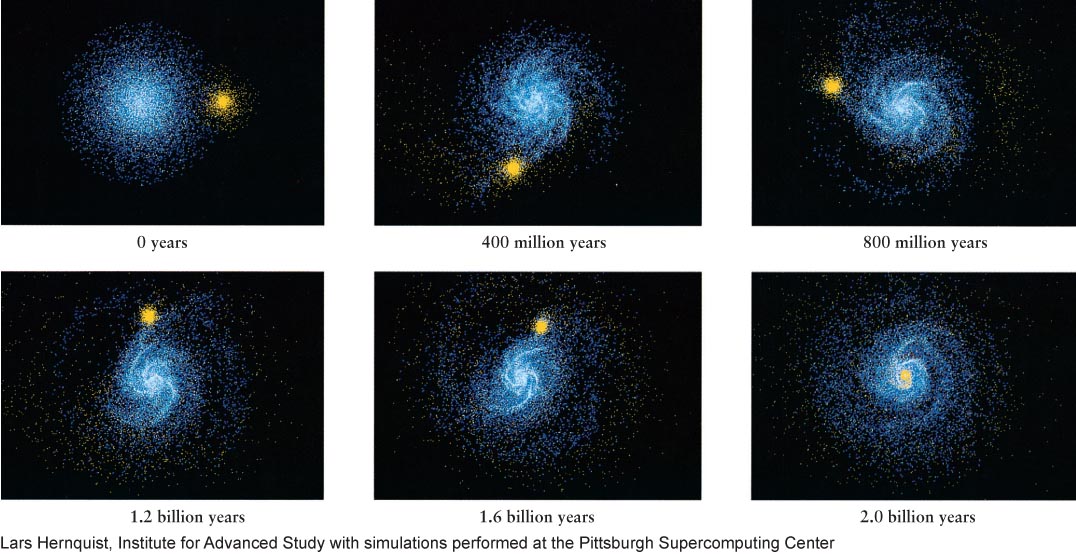
Figure 13-46: Simulated Galactic Cannibalism This computer simulation shows a small galaxy (yellow stars) being devoured by a larger, disk-shaped one (blue stars, white gas). Note how spiral arms are generated in the disk galaxy by its interaction with the satellite galaxy.
13-16 Dark matter helps hold together individual galaxies and clusters of galaxies
Focus Question 13-13
After the Milky Way collides with the Andromeda Galaxy, in what type of galaxy will our descendants likely live?
Quite a bit of evidence has accumulated to support the idea of extended dark matter halos surrounding all galaxies. For example, many spiral galaxies have rotation curves similar to those of our Milky Way (recall Figure 13-18). These rotation curves (Figure 13-47) remain remarkably flat out to surprisingly great distances from the galaxies’ centers. In all cases, the orbital speed is fairly constant. According to Kepler’s third law, we should see a decline in orbital speed toward the outer portions of a galaxy. In most cases, we do not, which implies that we still have not detected the true edge of these and many similar galaxies. As with the Milky Way Galaxy, astronomers conclude that a considerable amount of dark matter, introduced in Section 13-7, must extend well beyond the visible portions of most galaxies. While the fraction of a galaxy’s mass in dark matter is typically about 80%, some galaxies have much more of it. In 2010, a nearby dwarf galaxy, Segue 1, was observed to have a few thousand stars, but they are orbiting so rapidly that they must be under the influence of 500 times as much mass in dark matter!
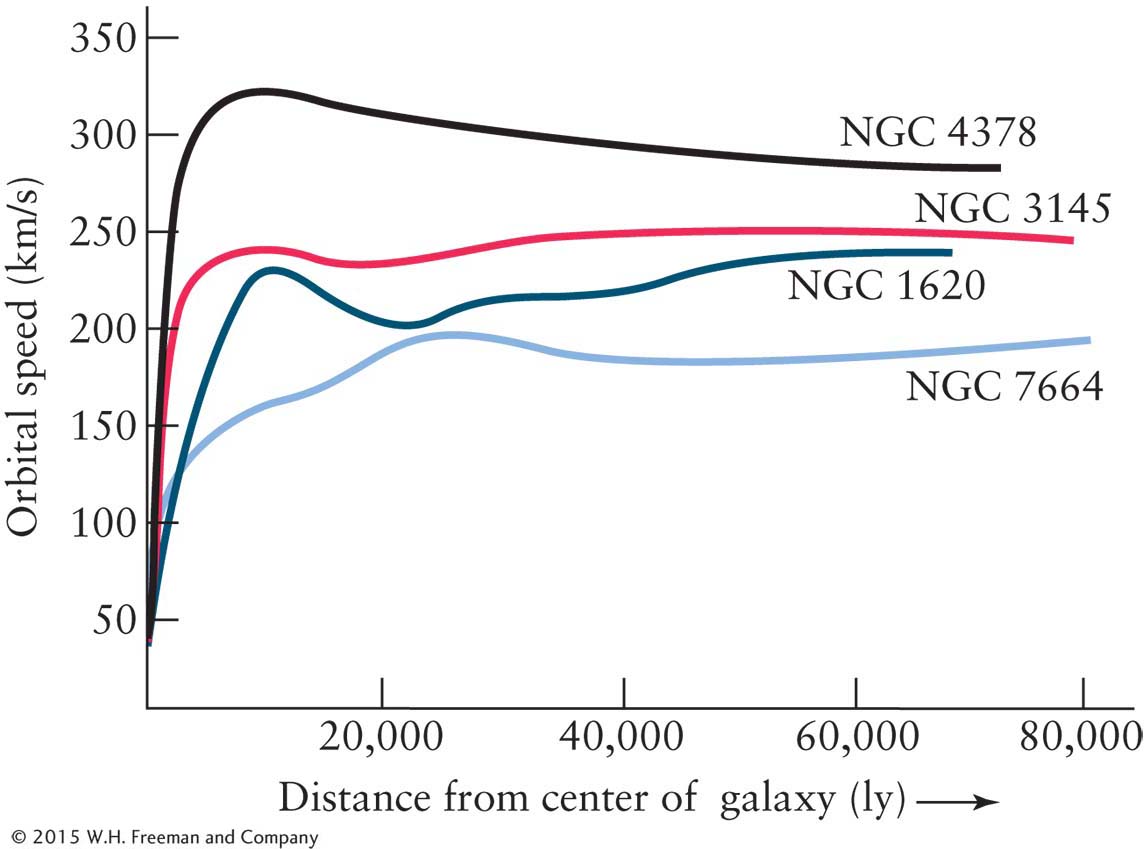
Figure 13-47: The Rotation Curves of Four Spiral Galaxies This graph shows how the orbital speed of material in the disks of four spiral galaxies varies with the distance from the center of each galaxy. If most of each galaxy’s mass were concentrated near its center, these curves would fall off at large distances. But these and many other galaxies have flat rotation curves that do not fall off. This indicates the presence of extended halos of dark matter. See Figure 13-18 to compare these to the Milky Way’s rotation curve.
As with the stars orbiting in a galaxy, there must be sufficient matter to provide the gravitational force necessary to bind galaxies together in clusters. However, no cluster of galaxies contains enough visible matter to stay bound together. Most of the matter binding clusters of galaxies together is dark matter. This must be true because, otherwise, the galaxies would have long ago wandered apart in random directions, and the clusters would no longer exist.
Analyses of all the visible mass demonstrate that the total mass needed to bind together a typical rich cluster is about 10 times greater than the mass of matter we can observe. Furthermore, observations of the distribution of galaxies in clusters have determined that the dark matter usually has the same distribution as the galaxies in the cluster and that each galaxy corresponds to a concentration of dark matter. We will see some exceptions to this latter point later in this chapter.
Astronomers using X-ray telescopes have discovered that some of the dark matter is actually very hot intergalactic gas. Satellite observations have revealed X-rays pouring from the space between galaxies in rich clusters that does not emit discernible visible light. This X-ray radiation is emitted by substantial amounts of hot intergalactic gas, as noted in the previous section. Figure 13-40b shows this hot gas in the center of the Coma cluster. Observations by the Chandra X-ray Observatory indicate that this intergalactic gas contains twice as much mass as exists in all of that cluster’s galaxies. Because its physical nature has now been identified, this intergalactic matter is no longer considered to be “dark.”
Nature assists astronomers with visualizing dark matter by the way its mass gravitationally warps space, as described by Einstein’s theory of general relativity (see Section 12-11). We saw in Section 13-7 how the same effect occurs on small scales here in the Milky Way. The local distortion is called microlensing, and when dark matter and the visible matter in entire galaxies or clusters of galaxies focus light from more distant galaxies, the effect is called gravitational lensing (Figure 13-48a). Figures 13-48b and 13-48c show the gravitationally lensed images of distant galaxies caused by dark matter and closer galaxies.
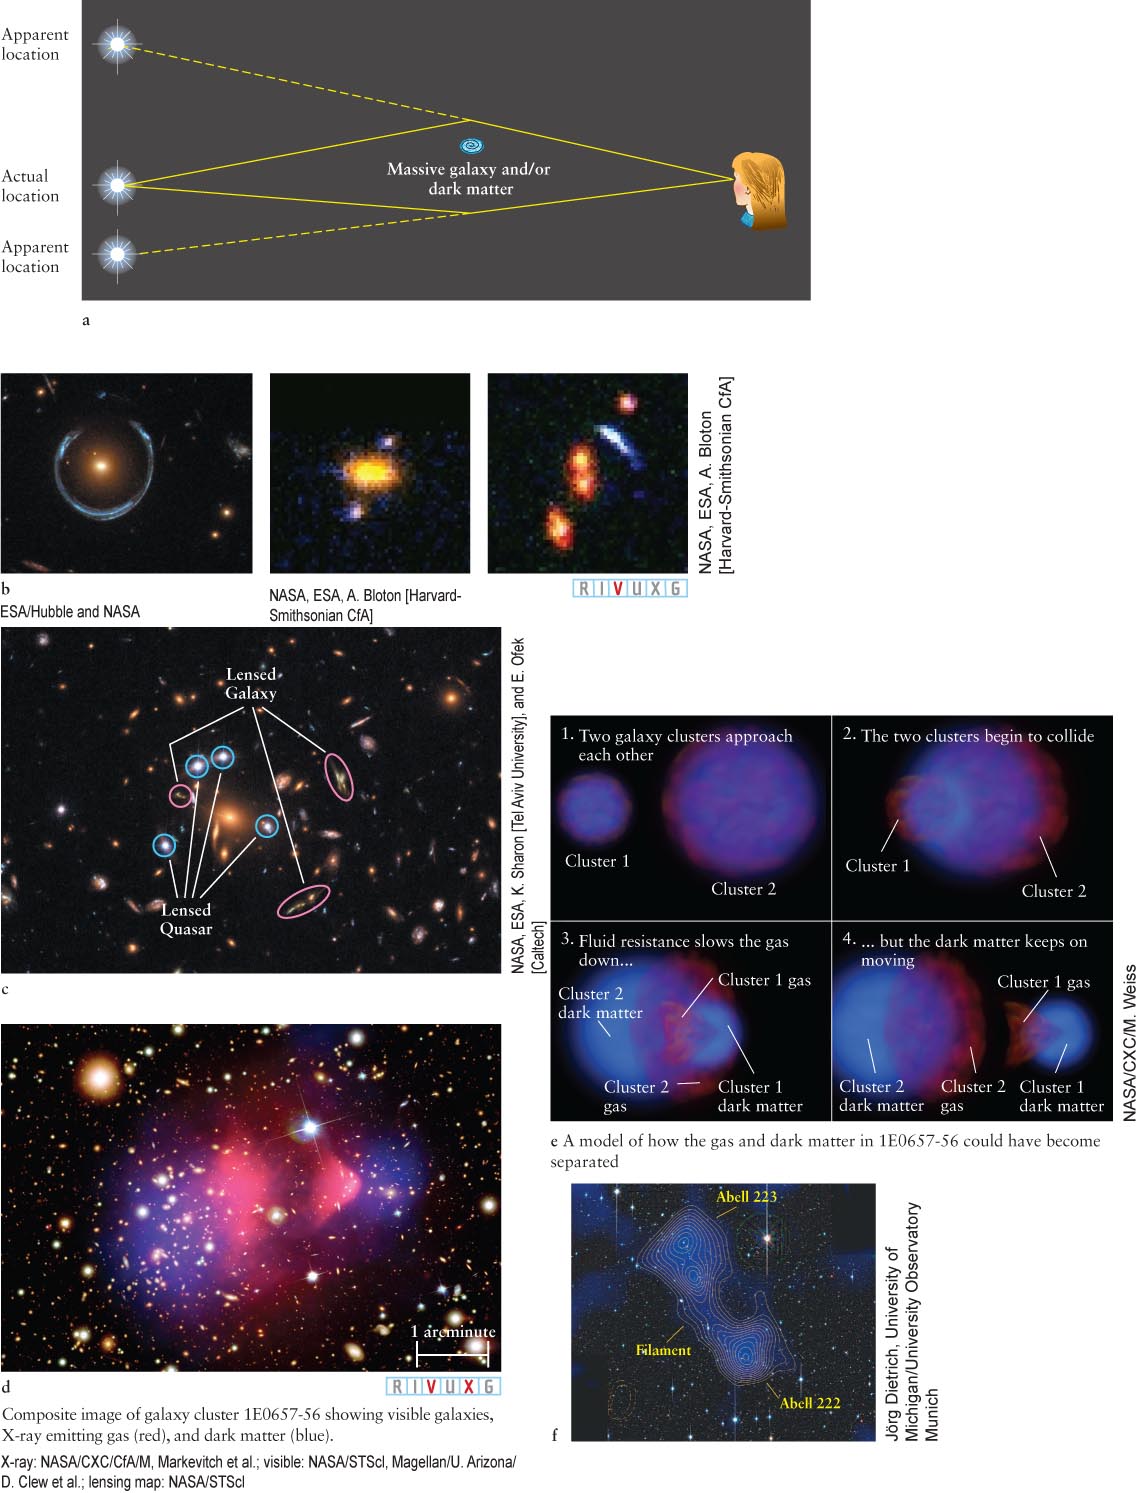
Figure 13-48:
 Gravitational Lensing of Extremely Distant Galaxies (a) Schematic of how a gravitational lens works. Light from the distant object changes direction due to the gravitational attraction of the intervening galaxy and underlying dark matter. The more distant galaxy appears in different places than it actually is. (b) Three examples of gravitational lensing: (1) The blue ring is a galaxy that has been lensed by the redder elliptical galaxy; (2) a pair of bluish images of the same object lensed symmetrically by the brighter, redder galaxy between them; and (3) the lensed object appears as a blue arc under the gravitational influence of the group of four galaxies. (c) This image shows the gravitational lensing of a distant galaxy and a distant quasar by a cluster of galaxies between them and us. (d) This cluster contains over a thousand galaxies. The red shows the cluster’s hot gas, while the blue is its dark matter, determined by gravitational lensing. (e) A mechanism proposed to explain the separation of gas and dark matter in clusters like (d). (f) Gravitational lensing by this filament of dark matter between two clusters of galaxies reveals its presence.
In 2000, astronomers observed an intergalactic cloud of gas the size of a galaxy. Observations revealed that for that gas to remain bound together, it must contain about 100 billion solar masses of matter. Because no galaxy exists in that space, astronomers conclude that the gas is held together by that much dark matter.
Sometimes visible matter and dark matter separate, shown in Figure 13-48d. This is presumably the result of two clusters of galaxies colliding (Figure 13-48e). The details of the mechanism by which this separation occurs are still under investigation. In 2007, astronomers observed distant galaxies undergoing gravitational lensing without the presence of an intervening visible galaxy. They deduced that the effect was caused by just the presence of dark matter. By observing such gravitational lensing, astronomers have observed a filament of dark matter stretching between two galaxy clusters, Abell 222 and Abell 223 (Figure 13-48f). This filament spans 59 Mly.
The amount of gravitational lensing by dark matter alone or by dark matter and a galaxy or by a cluster of galaxies provides astronomers with more than just enlarged, distorted images of distant objects. It tells us how much mass is contained in the dark matter and galaxy or cluster that does the lensing. The greater the mass doing the lensing, the greater the effect on the distant object. The visible matter in the galaxies accounts for only about 10% to 20% of the gravitational lensing that occurs. Thus, dark matter accounts for 80% to 90% of the mass in the universe.