SUPERCLUSTERS IN MOTION
Focus Question 13-14
If the dark matter in Figure 13-48d suddenly vanished, what would we see of the clusters of galaxies behind it?
Whenever an astronomer finds an object in the sky, one of the first tasks is to determine its composition. As we saw in Chapters 3 and 4, that means attaching a spectrograph to a telescope and recording the object’s spectrum. As long ago as 1914, the American astronomer Vesto Slipher, working at the Lowell Observatory in Arizona, took spectra of “spiral nebulae,” now known to be spiral galaxies. He was surprised to discover that the spectral lines of 11 of the 15 spiral nebulae that he studied were substantially redshifted. These redshifts indicate that they are moving away from the Milky Way at significant speeds. This result left scientists at that time with a major question: Is the universe expanding?
13-17 The redshifts of superclusters indicate that the universe is indeed expanding
During the 1920s, Edwin Hubble and Milton Humason recorded the spectra of many galaxies with the 100-in. telescope on Mount Wilson, confirming that most galaxies are rapidly receding from the Milky Way. This recession implies that the universe is expanding, although, as we will see in a moment, it does not imply that the Milky Way is at the center of it!
 Using the Doppler effect (recall Section 3-2), Hubble calculated the speed at which the galaxies are moving away from us. Using techniques such as determining the brightness of Cepheid variables (see Section 13-1), he also estimated the distances to several of these galaxies. He found a direct correlation between the distance to a galaxy and the size of its redshift: Galaxies in distant superclusters are moving away from us more rapidly than galaxies in nearby superclusters. Figure 13-49 shows this correlation for five elliptical galaxies. This recessional motion pervades the universe and is now called the Hubble flow.
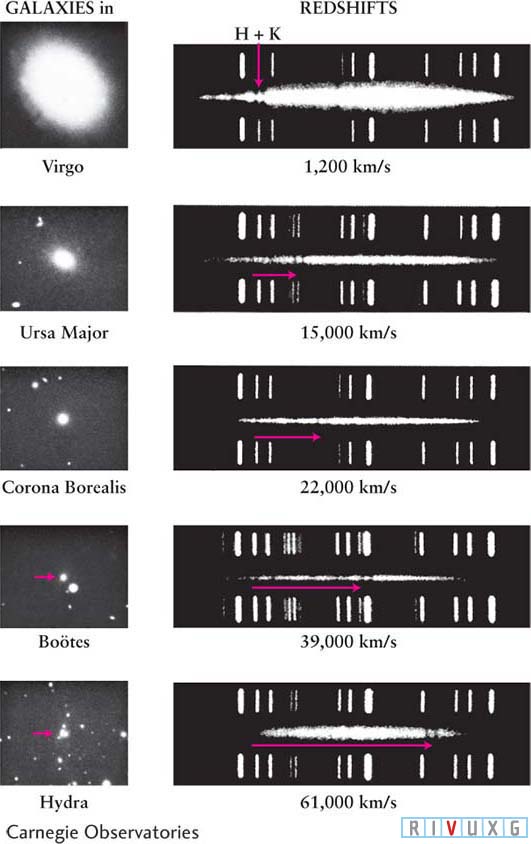
Figure 13-49:  Five Galaxies and Their Spectra The photographs of these five elliptical galaxies were all taken at the same magnification. They are labeled according to the constellation in which each galaxy is located. The spectrum of each galaxy is the hazy band between the comparison spectra at the top and bottom of each plate. In all five cases, the so-called H and K lines of calcium are seen. The recessional velocity (calculated from the Doppler shifts of the H and K lines) appears below each spectrum. Note that the fainter—and thus more distant—a galaxy is, the greater is its redshift.
The separation of clusters in the same supercluster from each other is slower than the general Hubble flow of the universe because these clusters are relatively close to one another, so their gravitational attractions slow each other down significantly. Keep in mind that the Hubble flow does not occur for galaxies in any given cluster, because all of those galaxies are gravitationally bound to each other. To recap, the Hubble flow applies to the separation of superclusters from one another.
When Hubble plotted the redshift data on a graph of distance versus velocity, he found that the points lie roughly along a straight line. The galaxies he observed were relatively close to the Milky Way (representing a small fraction of the volume of the universe). To get the big picture of how the universe is expanding, astronomers must measure the redshifts and distances to galaxies much further away. Although redshift measurements from spectra can be quite precise, it is very difficult to accurately measure the distances to remote galaxies. We cannot use the method of stellar parallax at the distances of galaxies. Recall from Section 10-1 that only the distances to the stars in our Galaxy within about 490 pc (1600 ly) can be determined very precisely this way.
Distances to other galaxies are determined from observations of the apparent magnitudes of objects in them or apparent magnitudes of entire galaxies. These observations are compared to known absolute magnitudes for similar objects. Having the apparent magnitude and the absolute magnitude enables astronomers to calculate distances, as discussed in Discovery 10-2: The Distance–Magnitude Relationship. Astronomers use the term standard candle to denote any object whose absolute magnitude is known. The various techniques used to determine large-scale distances are presented in Discovery 13-1: The Tully–Fisher Relation and Other Distance-Measuring Techniques. Figure 13-50 summarizes the distances for which all of the measuring techniques described here are valid.
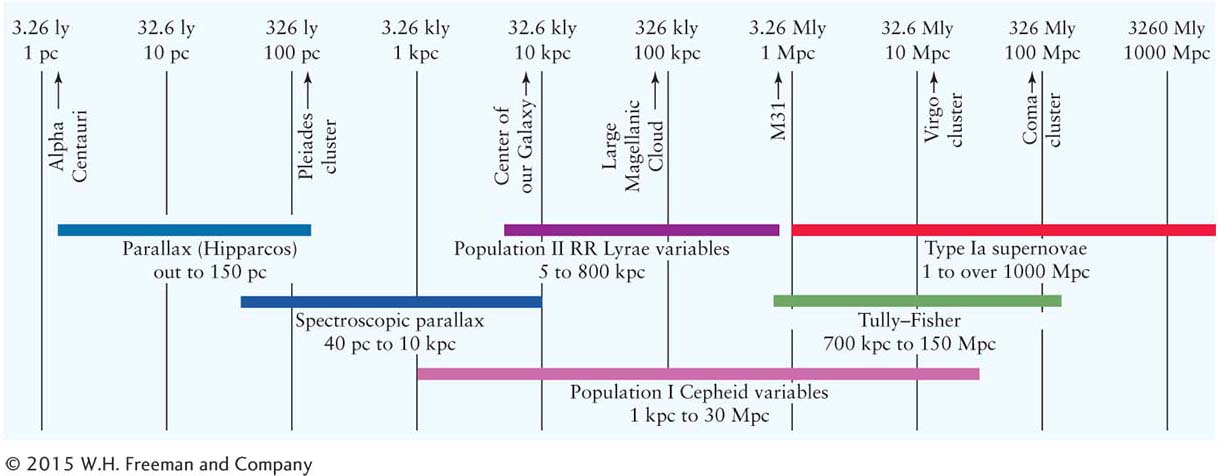
Figure 13-50: Techniques for Measuring Cosmological Distances Astronomers use different methods to determine different distances in the universe. All of the methods shown here are discussed in the text.
Figure 13-51 shows the relationship between the distances to galaxies and their recessional motion, including many whose extreme distances from us were measured using the apparent magnitude of Type Ia supernovae in them. You can see that all the distance-redshift data represent a straight line. The information in this figure can therefore be stated as a simple formula, called the Hubble law:
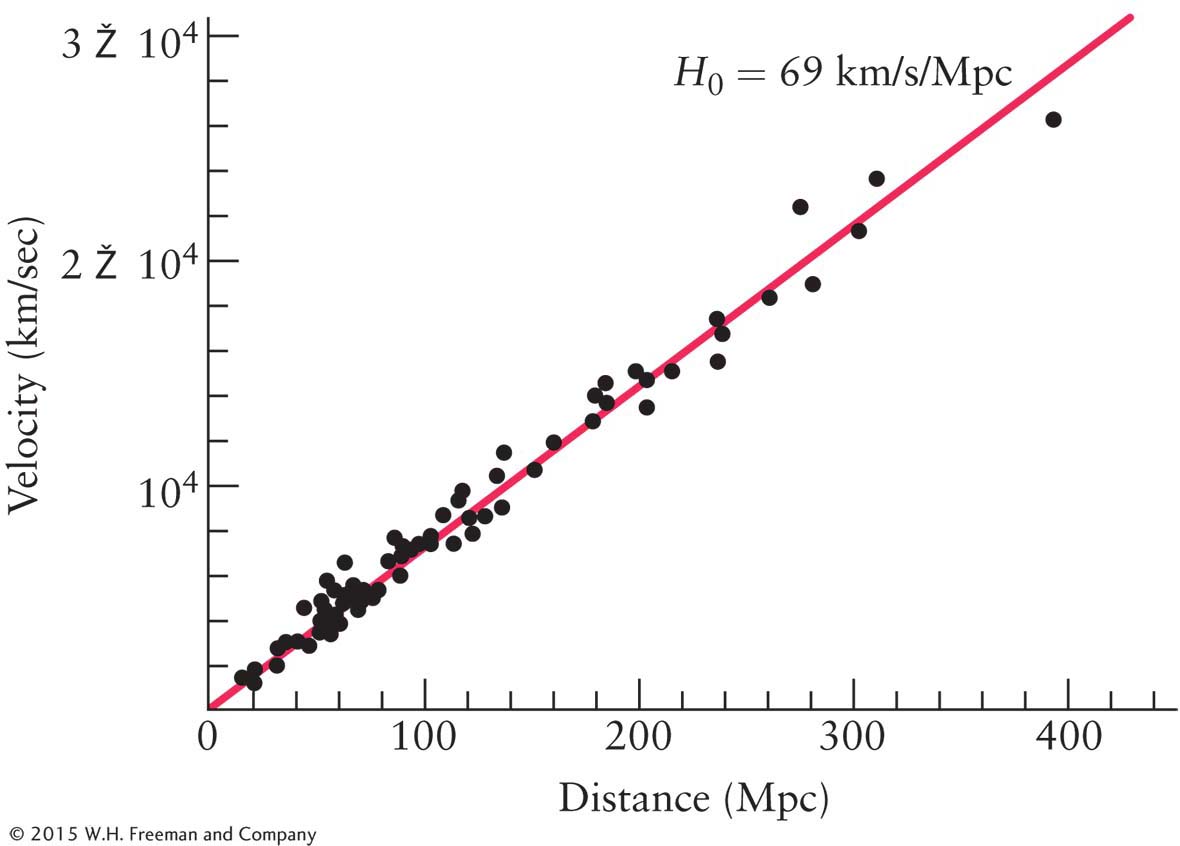
Figure 13-51: The Hubble Law The distances and recessional velocities of distant galaxies are plotted on this graph. The straight line is the “best fit” for the data. This linear relationship between distance and speed is called the Hubble law. For historical reasons, distances between galaxies, clusters of galaxies, and superclusters of galaxies are usually given in megaparsecs (Mpc) rather than millions of light-years.
Recessional velocity = H0 × distance
The straight line in Figure 13-51 has a slope denoted by the constant H0 (pronounced “H naught”), commonly called the Hubble constant. Using this diagram, astronomers have calculated that the Hubble constant is
This equation and its constant, H0, tell us that for every increase in distance of 1 Mpc, the galaxies are moving away from us 69 km/s faster than are those galaxies 1 Mpc closer to us. The Mpc is the standard unit of large distances used in this equation. The plus or minus 2 km/s/Mpc indicates the possible range for H0, when taking into account all of the errors that may still remain in the observations and calculations. A significant source of error is the effect of intergalactic gas that causes the standard candles to appear dimmer than they would if the gas were not present. Astronomers must determine the amounts of both intergalactic and interstellar gas and take their effects into account, which is often hard to do. It is worth noting that a variety of data sets used to determine the Hubble constant recently have given results ranging from 68 < H0 < 71, so clearly finding H0 is still a work in progress.
DISCOVERY 13-1: The Tully–Fisher Relation and Other Distance-Measuring Techniques
Spectroscopic parallax (see Section 10-9) provides distances for stars up to 10 kpc (33 kly, where kly denotes 1000 light-years). This distance is still within the Milky Way. To determine distances to other galaxies, we need sources in them that become very bright compared to the luminosity of normal stars and whose absolute magnitudes are well known. Using the brightnesses of RR Lyrae variable stars (see Section 11-11), astronomers can measure distances to the Large and Small Magellanic Clouds, about 100 kpc (330 kly). To measure the Hubble flow, we must determine distances to much more distant galaxies.
Cepheid variable stars (see Section 13-2 and Figure 13-3) can now be observed out to 30 Mpc (100 Mly, where Mly denotes a million light-years) from Earth. The distances to galaxies in this nearby volume of space can thus be determined from the Cepheid period– luminosity law. Plotting the distances to galaxies versus their recessional velocity for the small volume of space extending out 30 Mpc from Earth (shown on the left side of the graph in Figure 13-51) enabled astronomers to get a first estimate for H0 from the slope of the line through these data. This result gives H0 ≈ 75 km/s/Mpc. Errors in both distance and recessional velocities led to inaccuracies in the slope of this curve.
Beyond 30 Mpc, even the brightest Cepheid variables, which have absolute magnitudes of about −6, are not visible with current technology. In the 1970s, the astronomers Brent Tully and Richard Fisher developed another method for determining distances. They discovered that the width of the hydrogen 21-cm emission line of a spiral galaxy (discussed in Section 13-3) is related to the galaxy’s absolute magnitude: The broader the line is, the brighter the galaxy. The connection goes like this: Interstellar gas clouds in each galaxy orbit with speeds depending on their locations in the galaxy, as we have seen. Therefore, clouds in different places in a galaxy have different speeds toward or away from us, meaning that they have different Doppler shifts as seen from Earth. Consequently, we observe a variety of slightly different wavelengths from these clouds, centered around 21 cm: This combination of emissions makes the 21-cm emission line appear “broad.”
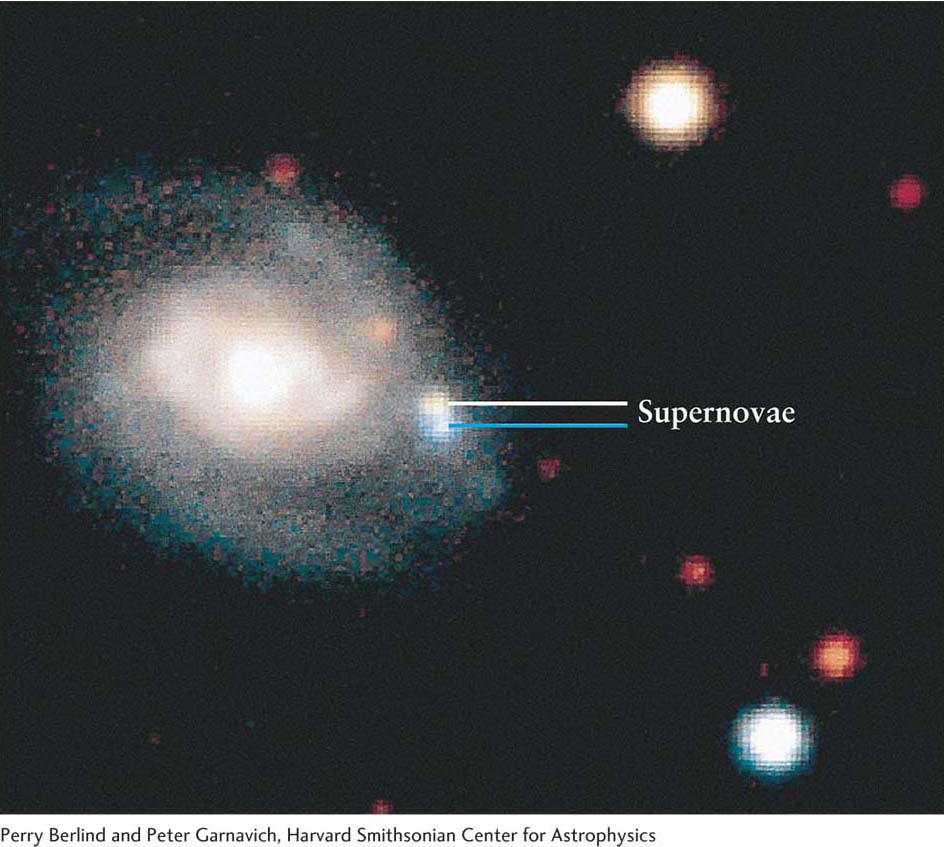
Two Supernovae in NGC 664 In 1997, the rare occurrence of two supernovae in the same galaxy at the same time was observed in the spiral galaxy NGC 664, located about 300 Mly (90 Mpc) from Earth. Supernovae observed in remote galaxies are important standard candles used by astronomers to determine the distances to these faraway objects. The two supernovae overlap each other, as shown. The upper, yellow-orange supernova was observed to occur 2 months before the hotter, blue one, which was observed to occur less than 2 weeks before this image was made and had not yet achieved maximum brightness.
The Tully–Fisher relation says that the greater the galaxy’s mass is, the greater is its luminosity and the more rapidly the stars and gas orbit in it. The faster it rotates, the greater the range of speeds and, hence, the greater the range of Doppler shifts we see from it. Measuring the width of the 21-cm line, therefore, tells us the galaxy’s mass. Assuming that stars with different masses and, hence, luminosities occur with the same frequencies in each galaxy, the galaxy’s mass tells us its absolute magnitude. Combining this with observations of the galaxy’s apparent magnitude allows us to calculate its distance from us using the distance–magnitude relationship (see Discovery 10-2: The Distance–Magnitude Relationship).
Because line widths can be measured quite accurately, astronomers can use the Tully–Fisher relation to determine the luminosities (absolute magnitudes) of many spiral galaxies and thus their distances from Earth.
The key method for determining the distances to the most remote galaxies is to measure the brightness of Type Ia supernova explosions within them. These supernovae all reach an absolute magnitude of −19 at the peak of their outbursts (see the figure below). Using their observed apparent magnitudes, their distances can be calculated. With this method, astronomers in 2001 measured a supernova nearly 3 billion parsecs (10 billion light-years) away, and more distant Type Ia supernovae have been measured since then. Measurements of distances to galaxies using the Tully–Fisher relation and Type Ia supernovae added data to Figure 13-51. Several space telescopes, most notably the Wilkinson Microwave Anisotropy Probe (WMAP) and the Planck Space Telescope, yield more data. Combining the data from the different methods yields a Hubble constant of 69 km/s/Mpc.
DISCOVERY 13-2: The Expanding Universe
To understand the universe, scientists build models—mathematical representations of the world around us. In developing these pictures, it often helps to begin with a simple analogy. Because the expansion of the universe is hard to visualize, imagine for a moment that batter for a chocolate-chip cake is floating in an oven in the International Space Station. As the cake bakes, it expands in all directions and the chocolate chips move farther apart. The chips do not get larger and do not move through the batter. Each chocolate chip remains at rest in its own little bit of cake and is carried along as the cake spreads out.
Now, think of each chocolate chip as a supercluster of galaxies and the batter between the chocolate chips as the rest of spacetime. As the universe expands, the distance between widely separated superclusters of galaxies grows larger and larger. The expansion of the universe is the expansion of spacetime.
Suppose you were on one particular chocolate chip, say, the chocolate chip labeled 3 in the oven at the left in the figure. You would see chocolate chips 2 and 4 moving away from you with equal velocities. Every 10 minutes, chocolate chips 2 and 4 get 1 cm farther away as the cake expands, as shown in the oven on the right. In that same time interval, chocolate chips 1 and 5 move twice as far away from you as chocolate chips 2 and 4. To go twice as far away in the same time, chocolate chips 1 and 5 must be moving twice as fast as the closer chocolate chips 2 and 4. This is exactly what Hubble’s law of cosmological expansion (recessional velocity = H0 × distance) says: Double the distance and you double the velocity.
To see why Earth need not occupy the center of the universe, put yourself on chocolate chip 4. You see chocolate chips 3 and 5 moving away at the same rate—in fact, they recede at the same rate as you saw chocolate chips 2 and 4 move away when you were on chocolate chip 3. From chocolate chip 4, chocolate chips 2 and 6 are moving away twice as fast as chocolate chips 3 and 5. From any chocolate chip, you will see all of the other chocolate chips moving away. Similarly, no matter where we are in the universe, we would see all of the other superclusters receding from us in the same manner.
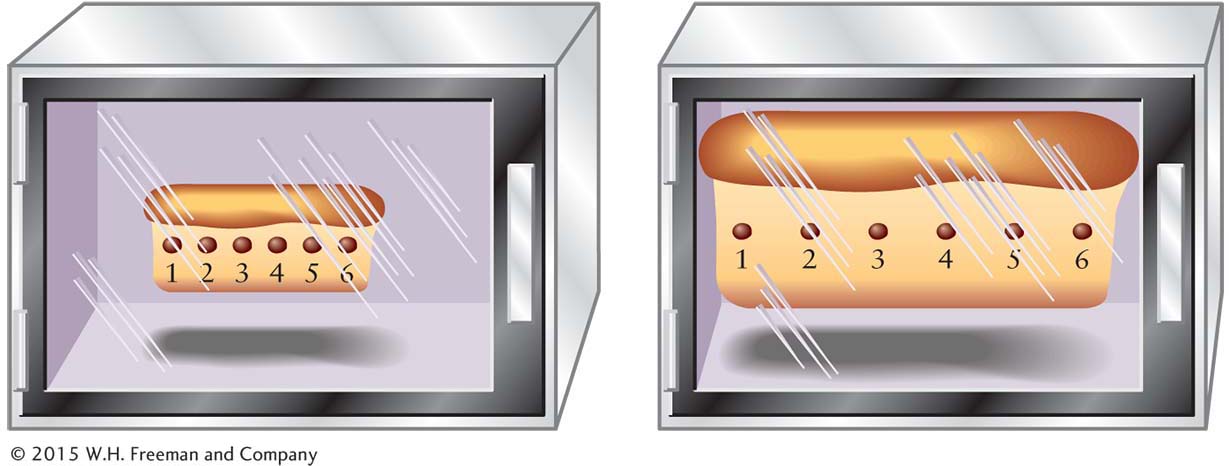
The Expanding Chocolate-Chip Cake Analogy The expanding universe can be compared to a chocolate-chip cake baking and expanding in the International Space Station. Just as all the chocolate chips move apart as the cake rises, the superclusters of galaxies recede from each other as the universe expands.
The relationship between the distances to galaxies and their redshifts was one of the most important astronomical discoveries of the twentieth century. It tells us that we are living in an expanding universe, and the Hubble law reveals the speed of that expansion. It also shows why we are not in the center of the universe, even though the other superclusters are all receding from us, as discussed in Discovery 13-2: The Expanding Universe.
13-18 Astronomers are looking back to a time when galaxies were first forming
The Hubble Space Telescope has been looking deeper and deeper into the universe. In 1998, working in concert with the Keck I telescope, Hubble observed galaxies 8 Bly (where Bly denotes a billion light-years) away, many of them in the process of merging (Figure 13-52). The same year it saw galaxies nearly 12 Bly away (Figure 13-52b). In 2012, galaxies up to 13.5 Bly away were observed. We are therefore seeing these latter objects as they were less than a billion years after the universe came into existence.
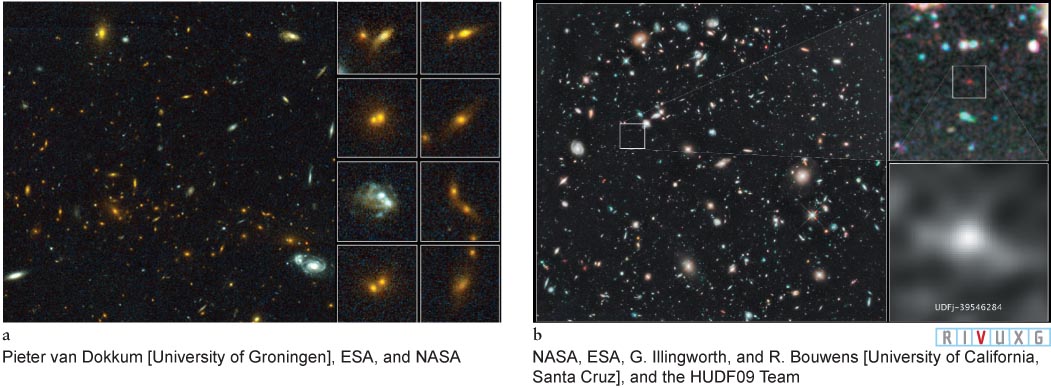
Figure 13-52:
Distant Galaxies (a) The young cluster of galaxies MS1054-03, shown on the left, contains many orbiting pairs of galaxies, as well as remnants of recent galaxy collisions. Several of these systems are shown at the right. This cluster is located 8 billion light-years away from Earth. (b) This image of more than 300 spiral, elliptical, and irregular galaxies contains a galaxy that is an estimated 13.2 billion light-years from Earth. A compact galaxy of blue stars that existed 480 million years after the Big Bang is shown in the images on the right.
Focus Question 13-15
If the Hubble constant were 3 times its present value, how much slower or faster would superclusters be moving apart?
Focus Question 13-16
In what way are telescopes time machines?
Although many of the early galaxies (meaning the ones farthest away from us) are not as well formed as nearby galaxies, the existence of galaxy-sized collections of stars so far back in time is an important clue to the processes of star and galaxy formation that occurred in the early universe. The clustering of galaxies began relatively early in the life of the universe, too, as the most distant known cluster of galaxies is 12.6 Bly away.
Insight Into Science
Power in Numbers Much of the power of science comes from expressing systematic data in mathematical form. By themselves, the spectra of galaxies give a qualitative picture of galactic motion, and the pattern of their recessional velocities suggests that a large-scale property of the universe is in effect here. When the data are converted into the equation, called the Hubble law, it becomes clear that the universe is expanding, and we can begin to look for the reason behind this expansion.
The observational data now being accumulated from the period of time when the universe was less than a few billion years old are helping astronomers develop and test theories of the evolution of the early universe. We will explore this point further in Chapter 14.
We next turn our attention to active galaxies— energy sources of staggering power. While the short-lived outputs of supernovae boggle the mind, they represent miniscule amounts of energy compared to quasars, Seyfert galaxies, radio galaxies, and BL Lac objects. Quasars, for example, emit more energy each second than the Sun does in 200 years, and they continue to do so for millions of years. Evidence shows that most galaxies undergo periods of similar activity. Some truly remarkable activity must occur deep within quasars and other ultrahigh-energy sources to make them so luminous.