BLACKBODY RADIATION
We begin our study of why we see what we see with a familiar property of matter—
3-12 An object’s peak color shifts to shorter wavelengths as it is heated
Imagine that you have mounted an iron rod in a vise in a completely darkened room. You cannot see the rod because it emits too few visible photons, and you cannot feel its warmth without touching it because it is at the same temperature as the air in the room. Now imagine that there is also a propane torch in the room. You light it and heat the iron rod for several seconds, until it begins to glow. At the same time, you can feel the rod warm up, meaning that it is also emitting more infrared radiation.
 The rod’s first visible color is red—
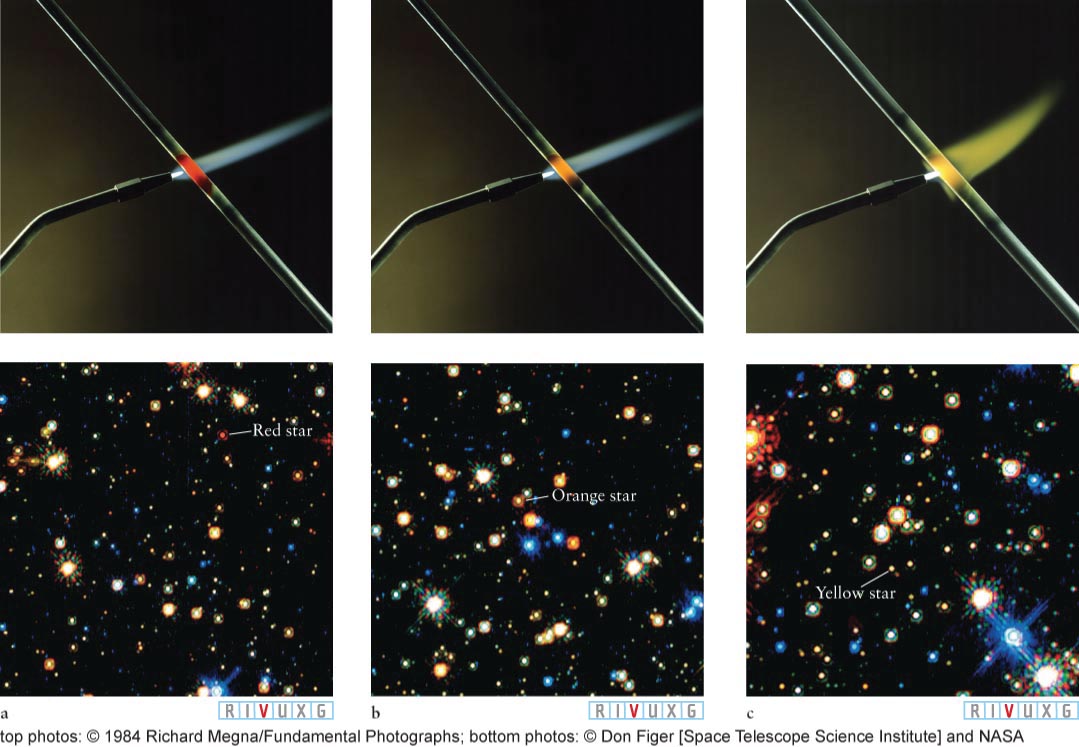

If you were to put the light emitted by a heated object, like the iron rod, through a prism or diffraction grating (which separates the colors of light, just like a prism), you would discover that all wavelengths are present and that one is brightest. This peak wavelength is the color that the object appears to have. The experiment with the rod reveals two principles about the electromagnetic radiation emitted by objects as their temperatures change:
80
As an object heats up, it gets brighter by emitting more electromagnetic radiation at all wavelengths.
The brightest color (most intense wavelength) of the emitted radiation changes with temperature.
Most objects big enough to be seen with the naked eye continuously emit electromagnetic radiation as just described. The peak wavelength of any object’s radiation, that is, where it emits most intensely, is denoted λmax. When the object is relatively cool, such as a rock or an animal, λmax is a radio, microwave, or infrared wavelength. When it is hot enough, like a fire or the Sun, λmax is in the range of visible light, giving a hot object its characteristic color. Exceptionally hot objects, such as some stars, emit λmax in the ultraviolet part of the electromagnetic spectrum.
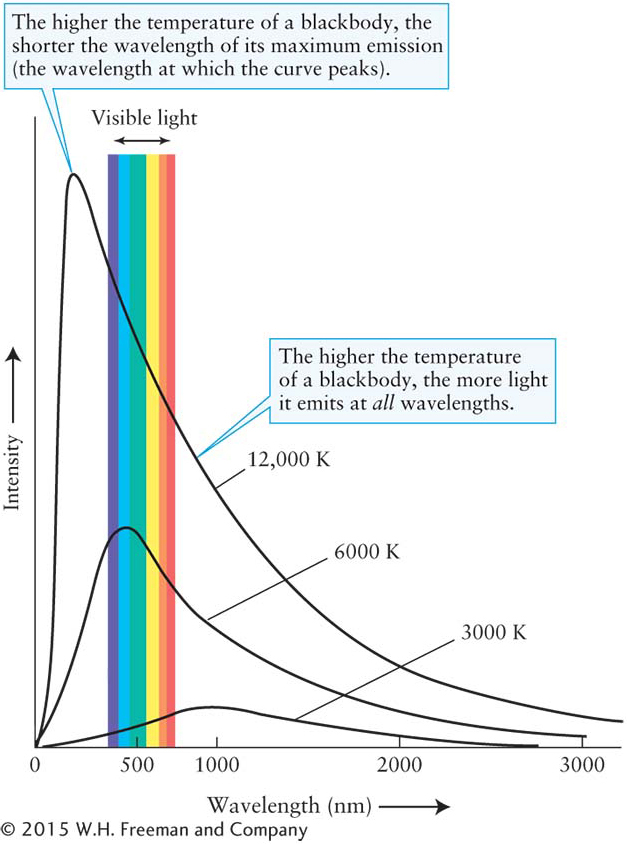
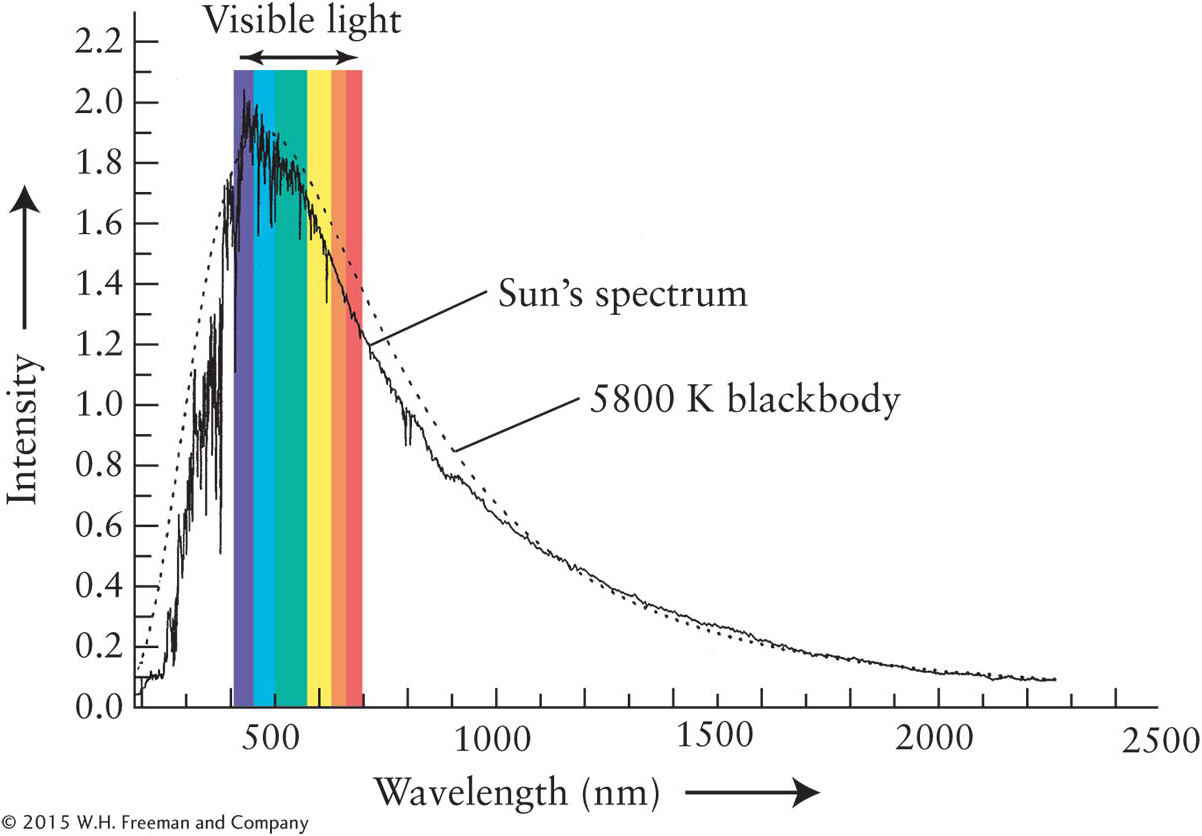
Stars, molten rock, and iron bars are approximations of an important class of objects that scientists call blackbodies. An ideal blackbody absorbs all of the electromagnetic radiation that strikes it. This incoming radiation heats up the blackbody, which then reemits the energy it has absorbed, but with different intensities at each wavelength than it received. Furthermore, the pattern of radiation emitted by blackbodies is independent of their chemical compositions. By measuring the intensity of radiation emitted by a blackbody at several wavelengths, it is possible to plot a curve of its emissions over all wavelengths (Figure 3-42). Ideal blackbodies have smooth blackbody curves, whereas objects that approximate blackbodies, such as the Sun, have more jagged curves whose variations from the ideal blackbody are caused by other physics (Figure 3-43).
81
The total amount of radiation emitted by a blackbody at each wavelength depends only on the object’s temperature and how much surface area it has. The bigger an object is, the brighter it is at all wavelengths. However, the relative amounts of different wavelengths (for example, the intensity of light at 750 nm compared to the intensity at 425 nm) depend on just the body’s temperature. So, by examining the relative intensities of an object’s blackbody curve, we are able to determine its temperature, regardless of how big or how far away it is. This process is analogous to how a thermometer tells your internal temperature no matter how big you are. (Temperatures throughout this book are expressed in kelvins. If you are not familiar with the Kelvin temperature scale, review Appendix B: Temperature Scales.)
Rather than absorb and reradiate light from an outside source like our iron rod, stars radiate electromagnetic radiation that is generated inside them. Even so, stars behave nearly like blackbodies, and the self-
Insight Into Science
Many Phenomena Result from Several Effects Recall from Section 3-
82
3-13 The relative intensities of different emitted colors reveal a star’s surface temperature
In 1893, the German physicist and 1911 Nobel laureate Wilhelm Wien showed that
The peak wavelength of radiation emitted by a blackbody is inversely proportional to its temperature.
In other words, the hotter any object becomes, the shorter is its λmax, and vice versa. Wien’s law, often called Wien’s displacement law, is the mathematical relationship between the location of the peak for each curve in Figure 3-
Wien’s law proves very useful in computing the surface temperature of a star. It says that to determine that temperature, all we need to find is the peak wavelength of its electromagnetic radiation—
In 1879, the Austrian physicist Josef Stefan observed that
An object emits energy per unit area at a rate proportional to the fourth power of its temperature in kelvins.
Think of the electric heating element on a stove. As this device becomes hotter, it gets brighter and emits more energy. Stefan’s result says that if you double the temperature of an object (for example, from 500 to 1000 K), the energy emitted each second from each piece of the object’s surface increases by a factor of 24, or 16 times. If you triple the temperature (for example, from 500 to 1500 K), the rate at which energy is emitted increases by a factor of 34, or 81 times. Stefan’s results were put on a firm theoretical foundation by Ludwig Boltzmann in 1885. In their honor, the intensity–
The Stefan-
Blackbody curves, such as those shown in Figure 3-
Although intensity curves of stars closely “follow” blackbody curves, they are not ideal blackbodies. The differences between an ideal blackbody curve and the curves seen from actual stars reveal stellar chemistries, the presence of companion stars and planets too dim to see, and the motions of stars toward or away from us, among other information. We begin studying these issues by considering the actual spectrum of the Sun.
83
 Figure 3-
The shapes of ideal blackbody curves were first derived from basic physical principles (and a deeper understanding of matter and energy than was available to Ludwig Boltzmann) in 1900 by the German physicist Max Planck. To determine these curves, he had to assume that objects receive electromagnetic radiation as individual packets of energy. This surprising assumption was reinforced in 1905 by Albert Einstein, who suggested that light—
Focus Question 3-10
Referring to Figure 3-
We can now describe our experiment with the iron bar at the beginning of this section in terms of the energies and intensities of photons. Recall from Section 3-
Focus Question 3-11
If a blackbody’s peak wavelength is in the infrared, the object is often visible to our eyes. What color will it have?
The relationship between the intensity of electromagnetic radiation at every wavelength emitted by a given blackbody and its temperature is called Planck’s law (Table 3-1): Planck’s law gives the shapes of the curves in Figure 3-
|
Wavelength (nm) |
Photon energy (eV)* |
Peak of blackbody temperature (K) |
|
|---|---|---|---|
|
Radio |
>107 |
<10−4 |
<0.03 |
|
Microwave** |
107 to 4 × 10⁵ |
10−4 to 3 × 10⁻³ |
0.03 to 30 |
|
Infrared |
4 × 10⁵ to 7 × 10² |
3 × 10⁻³ to 2 |
30 to 4100 |
|
Visible |
7 × 10² to 4 × 10² |
2 to 3 |
4100 to 7300 |
|
Ultraviolet |
4 × 10² to 101 |
3 to 103 |
7300 to 3 × 10⁶ |
|
X- |
101 to 10−2 |
103 to 105 |
3 × 10⁶ to 3 × 10⁸ |
|
Gamma ray |
<10−2 |
>105 |
>3 × 10⁸ |
Note: > means greater than; < means less than
*1 eV (electron volt) = 1.6 × 10⁻¹⁹ J
**Microwaves, listed here separately, are often classified as radio waves or infrared radiation.
84