9-1 The photosphere is the visible layer of the Sun
The Sun appears to have a surface only because most of its visible light comes from one specific gas layer (see Figure 9-1). This region, which is about 400 km (250 mi) thick, is appropriately called the photosphere (“sphere of light”). The density of the photosphere’s gas is low by Earth standards, about 0.01% as thick as the air we breathe. The photosphere has a blackbody spectrum (recall Chapter 3) that corresponds to an average temperature of 5800 K (see Figure 3-43).
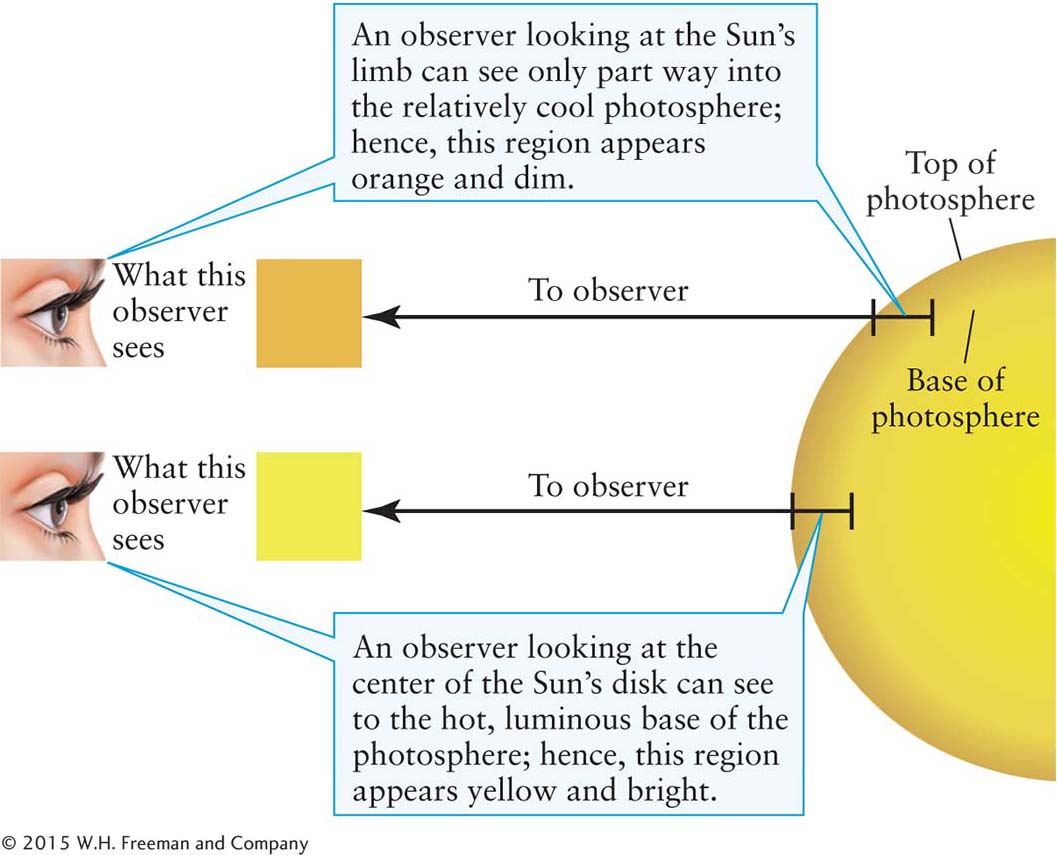
Figure 9-2: Limb Darkening The Sun’s edge, or limb, appears distinctly darker and more orange than does its center, as seen from Earth (see Figure 9-1). This phenomenon occurs because we look through the same amount of solar atmosphere at all places. As a consequence, we see higher in the Sun’s photosphere near its limb than when we look at its central regions. The higher photosphere is cooler and, because it is a blackbody, darker and more orange than the lower, hotter region of the photosphere.
 The photosphere is the innermost of the three layers that comprise the Sun’s atmosphere. Because the upper two layers (discussed in the following two sections) are nearly transparent to most wavelengths of visible light, we see through them down to the photosphere. We cannot, however, see through the shimmering gases of the photosphere, so everything below the photosphere is considered to be the Sun’s interior.
As you can see in Figure 9-1, the photosphere appears darkest toward the edge, or limb, of the solar disk, a phenomenon called limb darkening. This occurs because we see regions of different temperatures at different depths in the photosphere. Here is how it works: Wherever we look on the Sun, we see light through roughly equal amounts of the Sun’s atmosphere. Because the Sun is spherical, the light we see leaving the Sun at different places actually comes from different levels of the photosphere (Figure 9-2). Looking from Earth at the center of the Sun’s disk (see Figure 9-2, bottom black line), we see farther into the Sun’s atmosphere than when we look toward the limb (see Figure 9-2, top black line). The photosphere is hottest and brightest at its base, and so the center of the Sun’s disk, where we see deepest into it, looks brighter and yellower than does its limb.
Under good observing conditions and using a telescope with special dark filters for protection, you can see a blotchy pattern, called granulation, on the photosphere (Figure 9-3). The bright granules typically measure about 1000 km (620 mi) across and are surrounded by relatively dark boundaries. Time-lapse photography shows that granules form, disappear, and then reform in cycles that last several minutes. At any single moment, several million granules cover the solar surface.
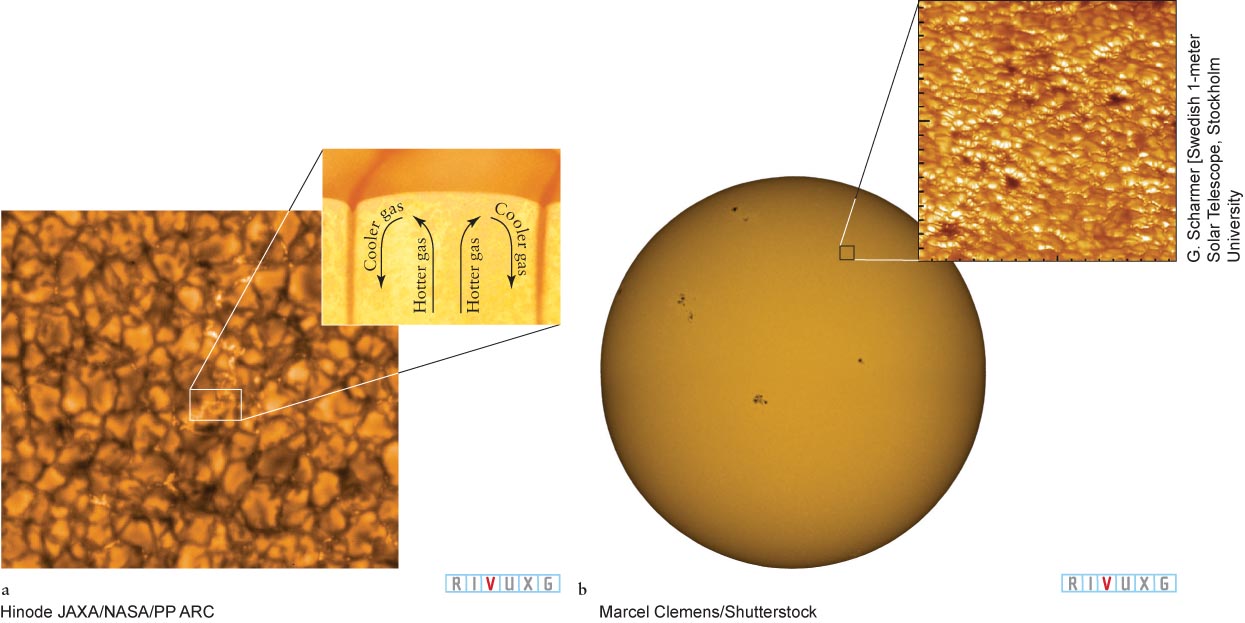
Figure 9-3:  Solar Granulation (a) High-resolution photographs of the Sun’s surface reveal a blotchy pattern, called granulation. Granules, which measure about 1000 km (620 mi) across, are convection cells in the Sun’s photosphere. Inset: Gas rising upward produces the bright granules. Cooler gas sinks downward along the darker, cooler boundaries between granules. This convective motion transports energy from the Sun’s interior outward to the solar atmosphere. (b) At lower resolution, the Sun’s surface appears relatively smooth (the dark regions will be discussed shortly). Inset: Viewed near the Sun’s limb, granules are seen to bulge upward at their centers as a result of the convection that creates them.
Focus Question 9-1
Which part of the disk of the Sun appears brighter, the center or the edge? Why?
Like liquid in a pot of simmering soup, the gases in granules rise and fall. In Section 3-18 we learned that radial motion of a light source affects the wavelengths of its spectral lines through the Doppler effect (see Figure 3-5). By carefully measuring the Doppler shifts of spectral lines in various parts of individual solar granules, astronomers have determined that hot gases move upward in the center of each granule and cooler gases cascade downward around its edges. This motion is caused by convection. We saw in Section 6-3 that convection moves the continents on Earth and in Section 7-1 that it also helps form the belts and zones on the giant planets. Once the Sun’s hot gases arrive at the photosphere, they radiate energy out into space. We see this energy as visible light and other electromagnetic radiation. Upon radiating, the gases cool, spill over the edges of the granules, and plunge back down into the Sun along the boundaries between granules (see Figure 9-3a inset).
Observations indicate that a granule’s center is typically 100 K hotter than its edge. According to the Stefan-Boltzmann law (see Section 3-13), hotter regions emit more photons per square meter than do cooler regions. That is why the centers of the granules are brighter than their edges, as you can see in Figure 9-3a.
9-2 The chromosphere is characterized by spikes of gas called spicules
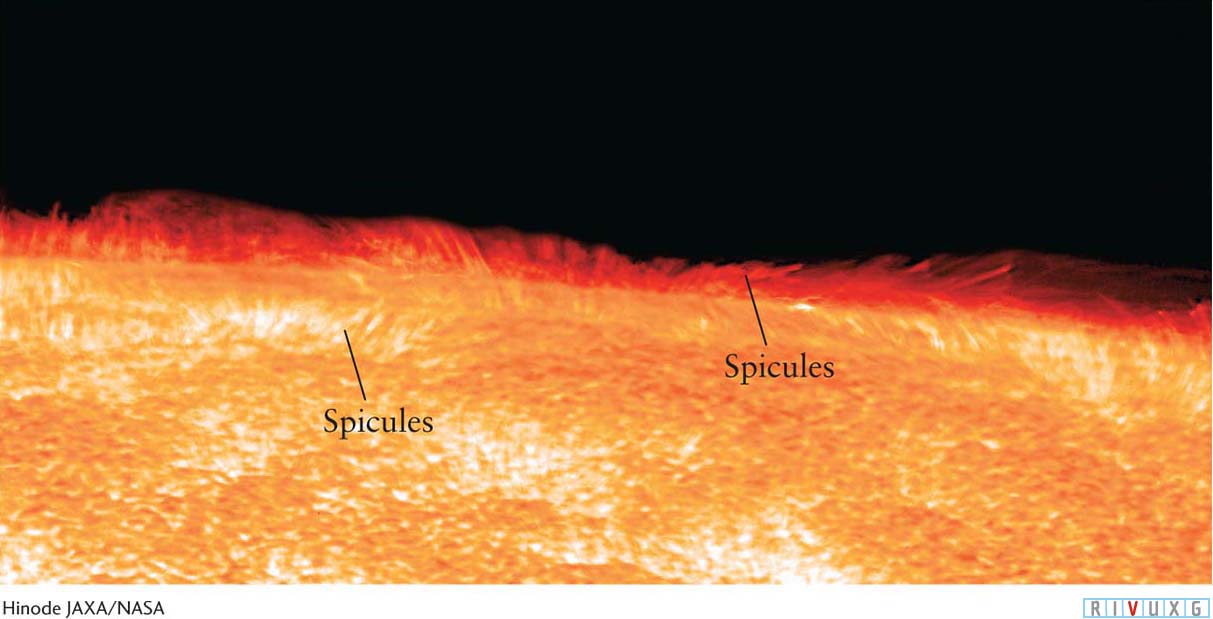
Figure 9-4:
The Chromosphere This photograph of the chromosphere was taken by the Hinode (Japanese for “sunrise”) satellite. The dark bumps are the tops of granules, and the light regions are hotter gases in spicules. The spicules on the edge or limb of the Sun give a sense of the height of these gas jets.
Immediately above the photosphere is a dim layer of less dense stellar gas, called the chromosphere (“sphere of color”). This unfortunate name suggests that it is the layer we normally see, but for centuries the chromosphere was visible only when the photosphere was blocked during a total solar eclipse.
Focus Question 9-2
Which part of the Sun do we normally see?
During an eclipse, the chromosphere is visible as a pinkish strip some 2000 km (1200 mi) thick around the edge of the dark Moon. Today, astronomers can also study the chromosphere through filters that pass light with specific wavelengths strongly emitted by it—but not by the photosphere—or through telescopes sensitive to nonvisible wavelengths that the chromosphere emits intensely (Figure 9-4).
High-resolution images of the chromosphere reveal numerous spikes, which are jets of gas called spicules (Figure 9-4 and Figure 9-5a). A typical spicule rises for several minutes at the rate of 72,000 km/h (45,000 mi/h) to a height of nearly 10,000 km (Figure 9-5b). Then it collapses and fades away. At any one time, roughly a third of a million spicules cover a few percent of the Sun’s chromosphere.
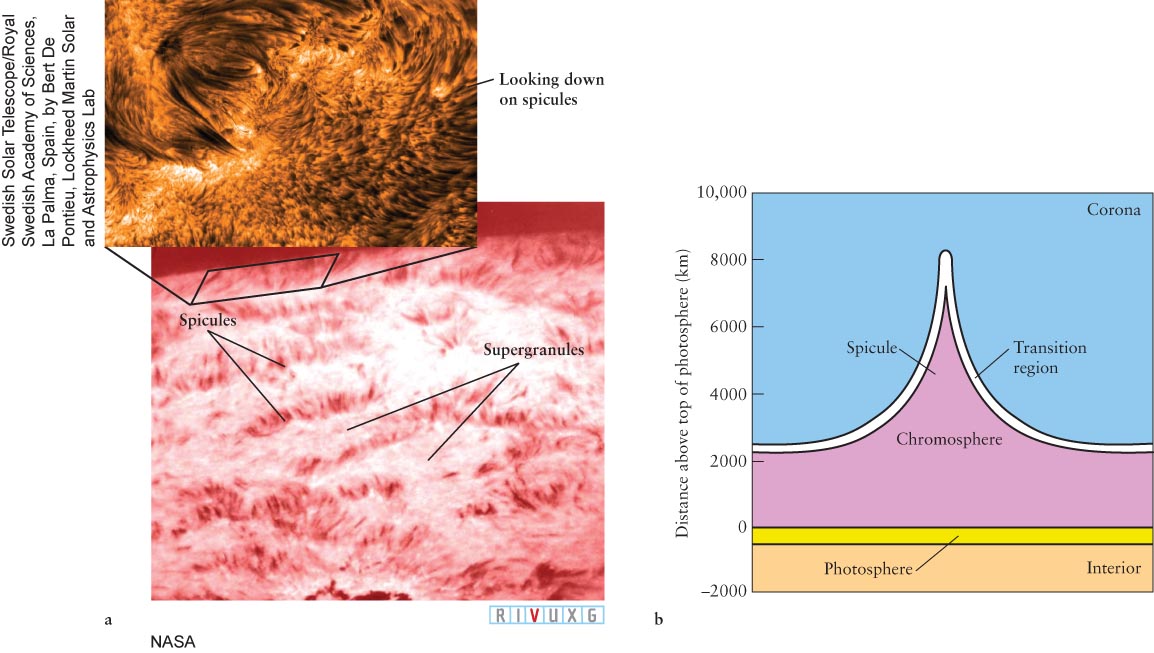
Figure 9-5:
Spicules and Supergranules (a) Spicules appear in this photograph of the Sun’s chromosphere. The Sun appears rose-colored in this image because the photo was taken through a Hα filter that passes red light from hydrogen and effectively blocks most of the photosphere’s light. Surrounded by spicules, supergranules are regions of rising and falling gas in the chromosphere. Each supergranule spans hundreds of granules in the photosphere below. Inset: A view of spicules from above. (b) The spicules are jets of gas that surge upward into the Sun’s outer atmosphere. This schematic diagram shows a spicule and its relationship to the solar atmosphere’s layers. The photosphere is about 400 km (250 mi) thick. The chromosphere above it extends to an altitude of about 2000 km (1200 mi), with spicules jutting up to nearly 10,000 km (6200 mi) above the photosphere. The outermost layer, the corona (discussed in Section 9-3), extends millions of kilometers above the photosphere.
Spicules are generally located on the boundaries of enormous regions of rising and falling chromospheric gas called supergranules (Figure 9-5a). A typical supergranule has a diameter slightly larger than Earth’s and contains about 900 granules.
9-3 The outermost layer of the Sun’s atmosphere, the corona, is exceptionally hot
It seems plausible that the temperature should decrease as you rise through the Sun’s atmosphere. After all, by moving upward, you move farther from the Sun’s internal heat source. Indeed, starting in the photosphere at 5800 K, the temperature drops to around 4000 K in the lower chromosphere. Surprisingly, however, the temperature then begins to increase as you ascend, reaching about 10,000 K at the top of the chromosphere. The outermost region of the Sun’s atmosphere, the corona, extends several million kilometers from the top of the chromosphere (Figure 9-6). Between the chromosphere and corona is a transition zone in which the temperature skyrockets to about 1 million K (see Figure 9-6c).
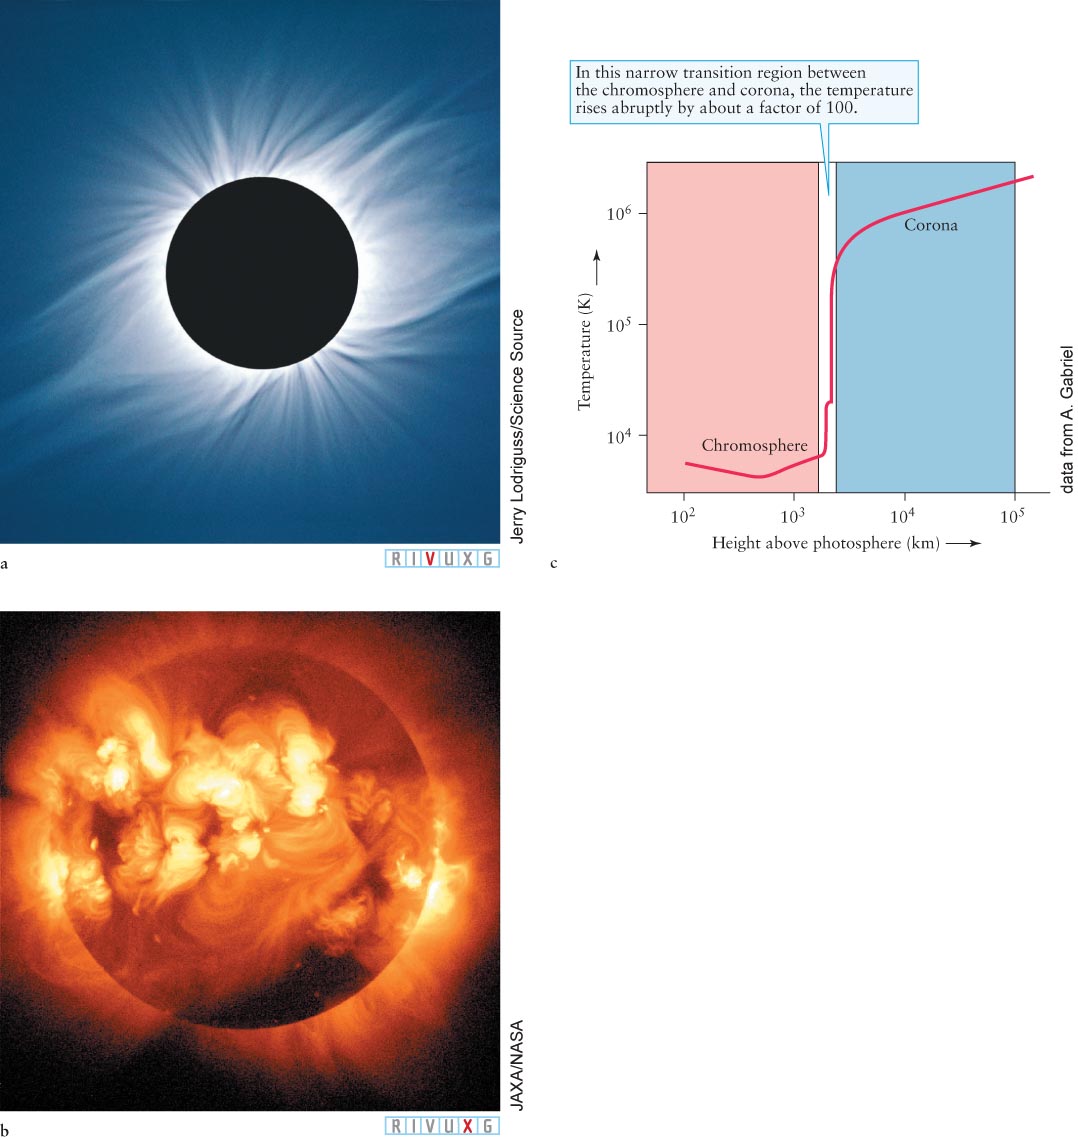
Figure 9-6:
 The Solar Corona (a) This visible-light photograph was taken during the total solar eclipse of July 11, 1991. Numerous streamers are visible, extending millions of kilometers above the solar surface. (b) This X-ray image of the Sun’s corona, taken by the Yohkoh satellite in 1999, provides hints of the complex activity taking place on and in the Sun. The million-degree gases in the corona emit the X rays visible here. (c) This graph shows how temperature varies with altitude in the Sun’s chromosphere and corona and in the transition region between them (white). Note that both the height and temperature scales are nonlinear.
This unexpected increase in temperature was discovered around 1940 as a result of the high temperature’s effect on the spectrum of the Sun’s corona. The hotter a gas is, the more it is ionized (electrons are stripped off the atoms). Astronomers discovered that the corona contains the emission lines of several highly ionized (therefore, very hot) elements. For example, a prominent green line caused by the presence of Fe XIV, an iron atom stripped of 13 electrons, appears in the coronal spectrum. (Recall from Section 3-16 that Fe I is a neutral iron atom.) It is now known that coronal temperatures are typically in the range of 1 million to 2 million K, although some regions are even hotter.
Although its temperature is extremely high, the density of gas in the corona is very low, about 10 trillion times less dense than the air at sea level on Earth. The low density partly accounts for the dimness of the corona, which otherwise would outshine the photosphere. Astronomers have observations suggesting two mechanisms that heat the corona. First, energy is apparently carried aloft and released there by the Sun’s complex magnetic fields, discussed in Sections 9-5 and 9-6. Second, jets of very hot gas, heated by a mechanism still under study, are sent up from the chromosphere into the corona.
The total amount of visible light that we receive from the solar corona is comparable to the brightness of the full Moon—or only about one-millionth as bright as the photosphere. As with the chromosphere, the corona can be seen only when the photosphere is blocked out or through special filters or at nonvisible wavelengths (such as ultraviolet and X-ray), at which the corona is especially bright compared to the photosphere and chromosphere.
The photosphere is blocked naturally during a total eclipse or artificially with a specially designed telescope, called a coronagraph. Figure 9-6a is a photograph of the corona taken during a total eclipse (see also Figure 1-26). Figure 9-6b shows a stunning X-ray image of the corona.
Just as Earth’s gravity prevents most of our atmosphere from escaping into space, so, too, does the Sun’s gravity keep most of its outer layers from leaving. However, some of the gas is moving fast enough—around a million kilometers per hour—to escape the Sun’s gravity forever and race into space. A portion of this gas comes directly from the corona, with the help of the Sun’s magnetic fields, while some of it is funneled out from below the corona, also by magnetic fields. This outflow of particles is called the solar wind. (We saw its effects on Earth’s magnetosphere in Section 6-5 and on comets in Section 8-7.) The heliosphere is a bubble in space created by the solar wind and solar magnetic field that contains the Sun and planets. The heliosphere extends from the Sun outward approximately 115 AU. The solar wind and the solar magnetic field that it drags out with it prevent most of the gases expelled in our direction by other stars from entering our solar system. During the years 2008–2010, the solar wind was the weakest it has been in recorded history. As a result, the heliosphere allowed in more particles than usual from outside the solar system, called galactic cosmic rays.
In 2008, using data from the two venerable Voyager spacecraft that were launched in 1977 and that are now in the process of leaving the solar system, astronomers found that the heliosphere is not spherical. This discovery happened because the two spacecraft were sent out in different directions (and launched 16 days apart), and Voyager 2 reached the inner edge of the heliosphere closer to the Sun than did Voyager 1. In August 2012, the Voyager 1 spacecraft departed from the heliosphere. Voyager 2 followed shortly. They are the first human-made objects to enter interstellar space.
The information from the Voyager spacecraft provides only two data points about the location of the boundary of the heliosphere. To get a complete map of this boundary, NASA launched the Interstellar Boundary Explorer (IBEX) in 2008. In 2013, NASA’s IBEX satellite discovered that the solar system has a tail of solar wind gases that extends out beyond the heliosphere into interstellar space. Guided by the Sun’s magnetic field, this tail is believed to dissipate by mixing with other interstellar gas.
The Sun ejects around 9 × 10⁸ kg (a million tons) of matter each second as the solar wind. Even at this rate of emission, the mass loss due to the solar wind will amount to only a few tenths of a percent of the Sun’s total mass throughout its lifetime. The solar wind particles reach speeds up to 2.9 × 10⁶ km/h (1.8 × 10⁶ mi/h). The wind achieves these high speeds, in part, by being accelerated by the Sun’s magnetic field, discussed in Section 9-5. By the time the solar wind travels 1 AU and arrives in the vicinity of Earth, it has spread out so much that there are typically just nine particles per cubic centimeter (cm3), and they are moving around 1.1 to 1.4 × 10⁶ km/h (6.8 to 8.5 × 10⁵ mi/h). For comparison, there are 6 × 10¹⁹ molecules/cm3 in the air we breathe, and the winds at Earth’s surface are moving less than 240 km/h (150 mi/h).
Astronomers think that the Sun’s surface chemical composition today is nearly identical to the composition of the solar nebula (see Section 4-2). Although electrons and hydrogen and helium nuclei comprise 99.9% of the solar wind, silicon, sulfur, calcium, chromium, nickel, neon, and argon ions have also been detected in it. To better understand the chemistry of the early solar system, the Genesis spacecraft was launched to collect pristine solar wind particles far outside Earth’s magnetosphere (see Section 6-5) and to return them to Earth. By studying the amounts of the different chemicals in the solar wind, astronomers hope to better understand how the Sun works, as well as to learn the chemistries of the earlier generation of stars that exploded and whose gases eventually recondensed and formed the Sun and the other objects in the solar system. While attempting to land in 2004, Genesis’s parachute failed and the spacecraft crashed into Earth at 320 km/h (about 200 mi/h) (see Section 8-7). Nevertheless, the collected samples have been salvaged, and as mentioned in Section 8-7, they reveal that the amounts of each isotope of nitrogen and oxygen (atoms of nitrogen and oxygen that have different numbers of neutrons in their nuclei) in the solar wind and Earth’s atmosphere are not identical, leading to new questions about the evolution of the early solar system.
Focus Question 9-3
Which of the Sun’s three atmospheric layers is coolest? Which is densest?
Another important result from the Genesis mission concerns the chemistry of neon in the Sun. The amounts of different neon isotopes in the Moon rocks brought back by Apollo astronauts suggested that the Sun was more active (hotter) in the past than it is today. However, the amounts of neon isotopes collected by Genesis were different from those in the Moon rocks. Astronomers deduce that the neon at different depths of the Moon was chemically altered by different amounts due to the radiation from space over billions of years. Taking this into account, they conclude that the Sun has maintained a more nearly constant temperature than previously believed.
 Although astronomers often speak of the solar “surface,” the Sun is so hot that it has neither liquid nor solid matter anywhere inside it. Moving down through the Sun, we continually encounter ever denser and hotter gases.