THE ACTIVE SUN
Granules, supergranules, spicules, and the solar wind occur continuously. But the Sun’s atmosphere is also periodically disrupted by magnetic fields that stir things up, creating a group of phenomena known collectively as the active Sun. The Sun’s most obvious transient features are sunspots, regions of the photosphere that appear dark because they are cooler than the rest of the Sun’s lower atmosphere. Sometimes sunspots occur in isolation (Figure 9-7a), but often they arise in clusters, called sunspot groups (Figure 9-7b).
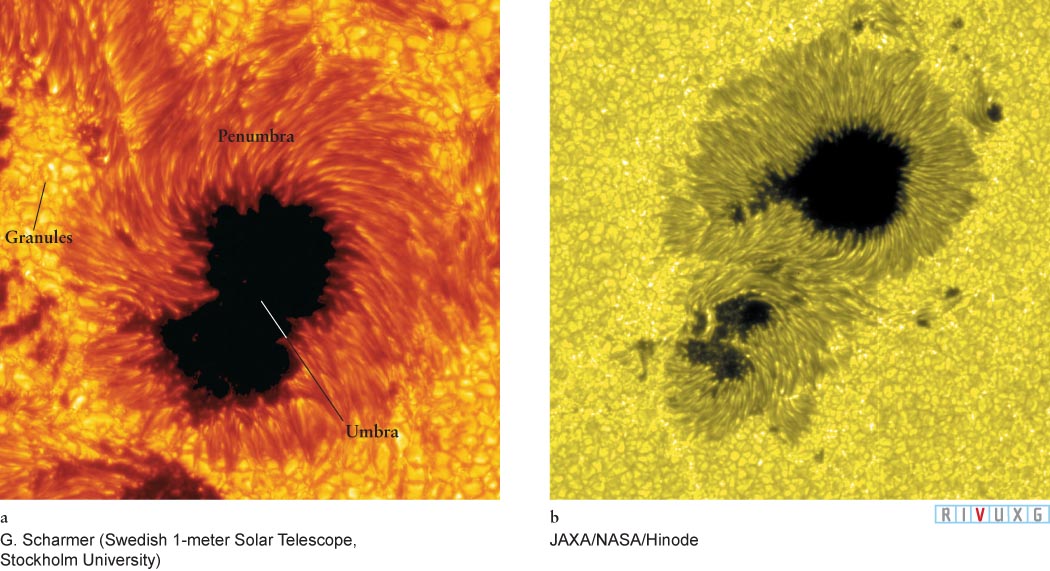
Figure 9-7  Sunspots (a) This dark region on the Sun is a typical isolated sunspot. Granulation is visible in the surrounding, undisturbed photosphere. (b) This high-resolution photograph shows a sunspot group in which several sunspots in a large group overlap.
9-4 Sunspots reveal the solar cycle and the Sun’s rotation
Like other transient features of the active Sun, the average number and location of sunspots vary in fairly predictable cycles because of the changes in magnetic fields that produce them (as we will explore in Section 9-5). The sunspot cycle was discovered in 1843 by the German astronomer Samuel Schwabe. As shown in Figure 9-8a, the average sunspot cycle lasts approximately 11 years. Within an 11-year cycle, the largest numbers of sunspots are seen during the sunspot maximum of that cycle (Figure 9-8b). Sunspot maxima occurred most recently in 1979, 1989, 2001, and 2013. During a sunspot minimum, the Sun is often devoid of sunspots, as it was in 1986, 1997, and 2008 (Figure 9-8c). The next minimum in the cycle is projected to occur in 2019.
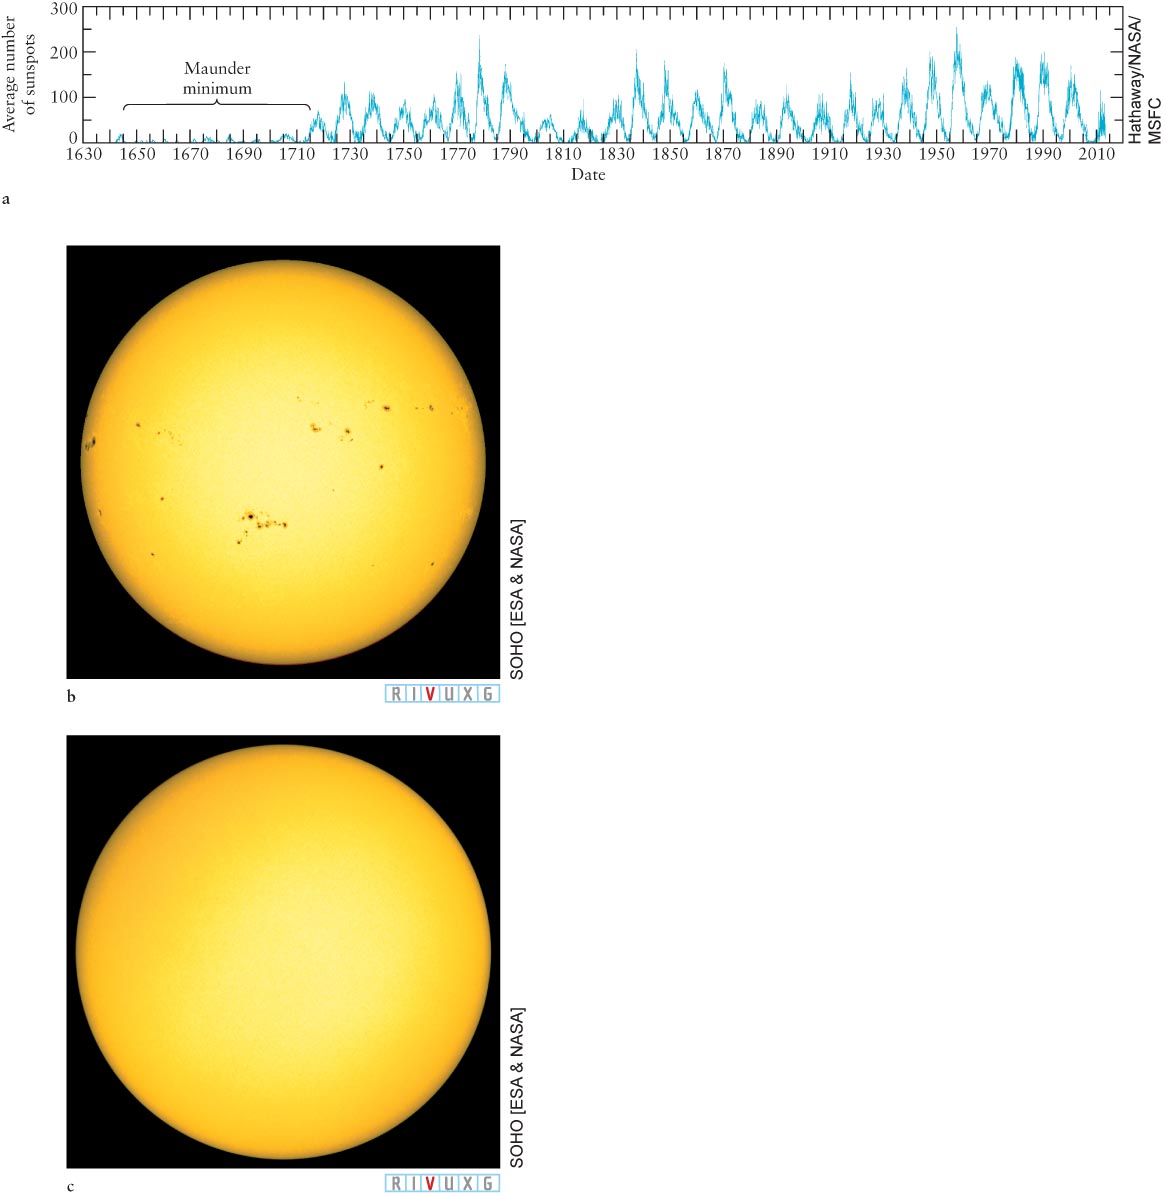
Figure 9-8
The Sunspot Cycle (a) The number of sunspots on the Sun varies with a period of about 11 years. The most recent sunspot maximum occurred in 2013, and the most recent sunspot minimum began in 2007 (and continued through 2010). (b) The active Sun has many sunspots (this photo was taken in 1979). (c) The Sun has many fewer sunspots when it is not active (this photo, showing a time with no sunspots, was taken in 1986).
A typical sunspot is 10,000 km (6200 mi) across and lasts between a few hours and a few months. Each sunspot has two parts: a dark, central region, called the umbra, and a brighter ring that surrounds the umbra, called the penumbra (see Figure 9-7). Although these are the same names as the blocked areas of an eclipse (see Section 1-13), we will see in the next section that their causes are completely different—another good example of how certain astronomical terms can have different meanings in different contexts.
Seen without the surrounding brilliant granules that outshine it, a sunspot’s umbra appears red and its penumbra is orange. According to Wien’s law (see Section 3-13), these colors indicate that the umbra is typically 4300 K and the penumbra is 5000 K, both cooler than the normal photosphere.
On rare occasions, a sunspot group is so large that it can be seen with the unaided eye. Chinese astronomers recorded such sightings 2000 years ago, and a huge sunspot group visible to the naked eye was seen in 2001. Always use special dark filters or other means to protect your eyes when viewing the Sun. Looking directly at the Sun for more than a few moments causes eye damage! Of course, a telescope gives a much better view, so it was not until Galileo used one that anyone examined sunspots in detail.
 By following sunspots as they moved across the solar disk (Figure 9-9), Galileo discovered that the Sun rotates once in about 4 weeks. He did this by observing the Sun indirectly, using the technique developed by his protégé Benedetto Castelli of projecting the telescope image of the Sun on a screen. (It is unlikely that Galileo’s blindness in old age was caused by looking at the Sun. Rather, it is believed that his blindness came as a result of medical issues, probably glaucoma and cataracts.)
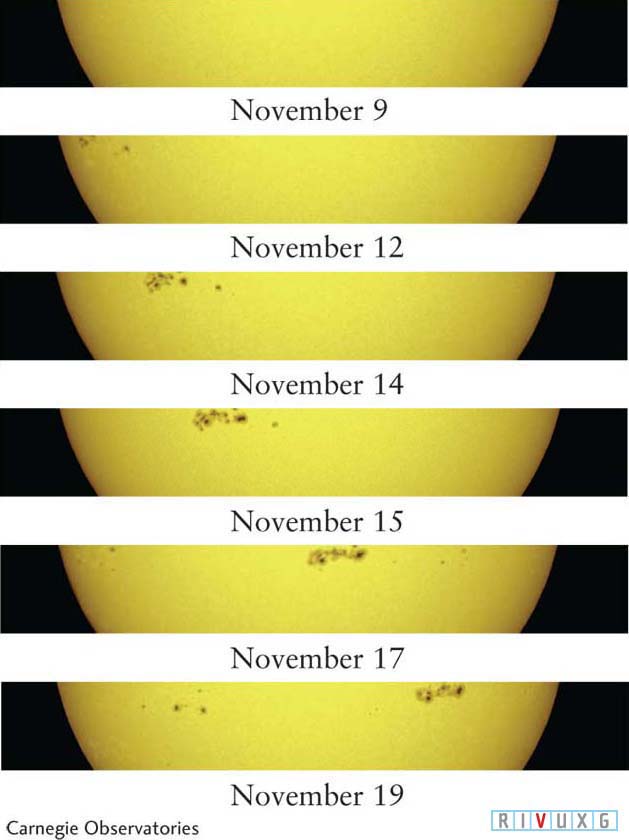
Figure 9-9
The Sun’s Rotation This series of photographs taken in 1999 shows the same sunspot group over one-third of a solar rotation. Note how the sunspot groups changed over this time. By observing a group of sunspots from one day to the next in this same manner, Galileo found that the Sun rotates once in about 4 weeks. Sunspot activity also reveals the Sun’s differential rotation: The equatorial regions rotate faster than the polar regions.
Insight Into Science
Perception versus Reality Our senses (and often our technology) are limited, so we must be careful about interpreting what we perceive. For example, the sunspots in Figure 9-7 certainly look like black spots. However, they appear black only in contrast to the bright light around them. As we will discuss shortly, sunspots are actually red and orange.
Because a typical sunspot group lasts about 2 months, it can be followed for two solar rotations. Sunspot activity also reveals that like the giant planets, different latitudes of the Sun rotate at different rates, a phenomenon called differential rotation: The equatorial regions rotate more rapidly than the polar regions. A sunspot near the solar equator takes 25 days to go once around the Sun, whereas a sunspot at 30° north or south of the equator takes about 27 days. The rotation period at 75° north or south of the equator is about 33 days, and near the poles it is as long as 35 days.
The average latitude at which new sunspots appear changes throughout the sunspot cycle. At the beginning of each cycle, the sunspots appear mostly at about 30° north and south latitudes. Those sunspots that form later in the cycle typically occur closer to the equator.
Focus Question 9-4
Which area of the photosphere is hottest, a sunspot’s umbra, its penumbra, or a granule?
The “butterfly diagram” presented in Figure 9-10 shows that the range of latitudes on which sunspots are located and the average latitude at which they are found vary at the same 11-year rate as does the number of sunspots. Satellite measurements reveal that the Sun emits about 0.1% more energy at the peak of the sunspot cycle than at its minimum.
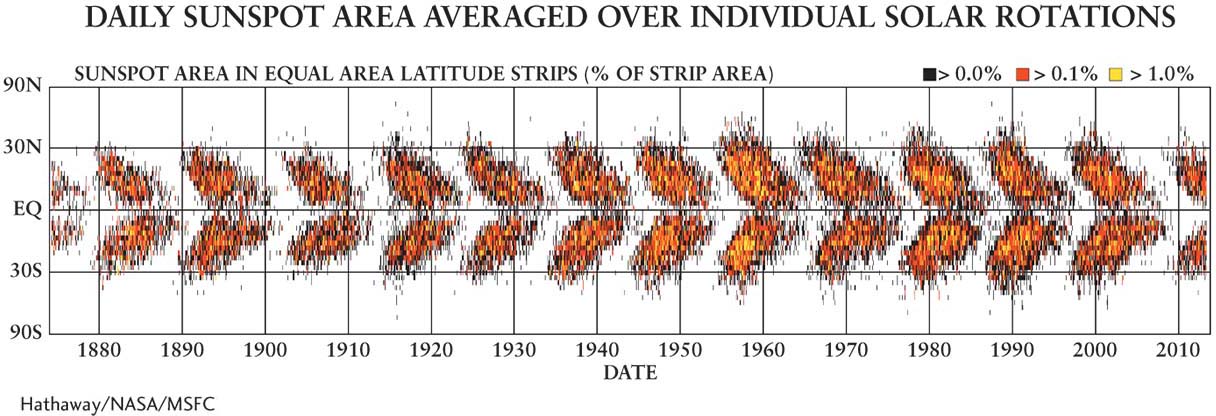
Figure 9-10 Locations of Sunspots Throughout the Sunspot Cycle This “butterfly” diagram of sunspot locations shows that sunspots occur at changing latitudes throughout each cycle. From most common locations to least, the diagram is color-coded yellow, orange, and black.
9-5 The Sun’s magnetic fields create sunspots
In 1908, the American astronomer George Ellery Hale discovered that sunspots are directly linked to intense magnetic fields on the Sun. When Hale focused a spectroscope on sunlight coming from a sunspot (Figure 9-11a), he found that each spectral line in the normal solar spectrum is flanked by additional, closely spaced spectral lines not usually observed (Figure 9-11b). This “splitting” of a single spectral line into two or more lines is called the Zeeman effect. The Dutch physicist Pieter Zeeman, who first observed it in the laboratory in 1896, showed that an intense magnetic field splits the spectral lines of a light source inside the field. The more intense the magnetic field, the more the split lines are separated.
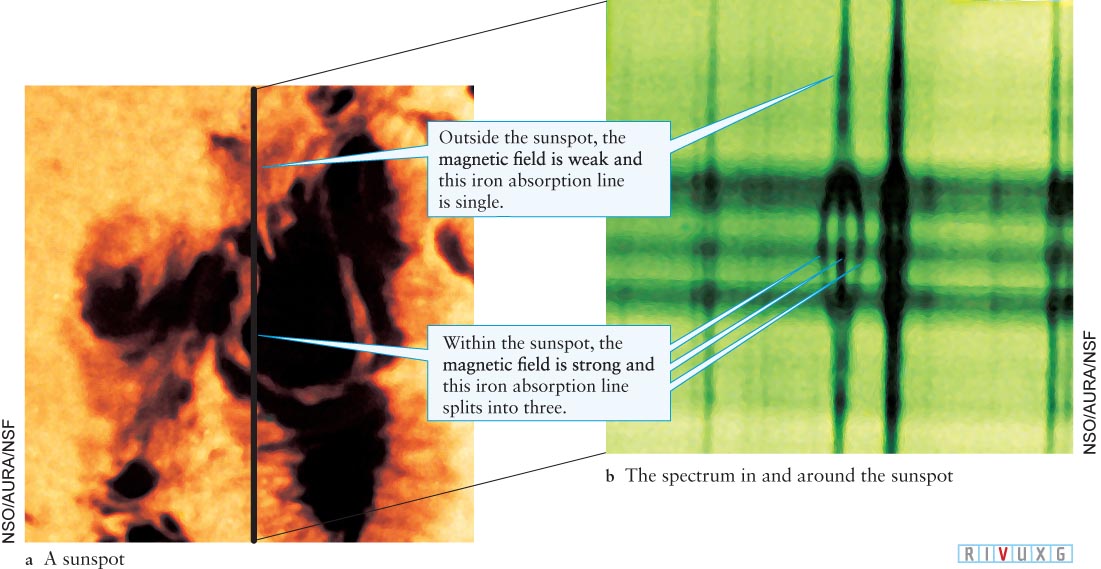
Figure 9-11
Zeeman Splitting by a Sunspot’s Magnetic Field (a) The black line drawn across the sunspot indicates the location toward which the slit of the spectroscope was aimed. (b) In the resulting spectrogram, one line in the middle of the normal solar spectrum is split into three components by the Sun’s magnetic field. The amount of splitting between the three lines is used to determine the magnetic field’s strength. Typical sunspots have magnetic fields some 5000 times stronger than Earth’s magnetic field.
Sunspots are areas where concentrated north or south magnetic fields project through the hot gases of the photosphere. But how do these fields create the spots? The answer lies in the interaction between the magnetic fields and the photosphere’s gases. Because of the photosphere’s high temperature, many atoms in it are ionized: One or more of their electrons have been stripped off by high-energy photons there. As a result, the photosphere is a mixture of electrically charged ions and electrons, called a plasma.
Plasmas are extremely good conductors of electricity and are repelled from regions of high magnetic field. Therefore, the magnetic field protruding through the photosphere prevents hot, ionized gases inside the Sun from convecting to the surface as they normally do. Thus, such regions of the photosphere are left relatively devoid of hot gas and are therefore cooler and darker than the surrounding solar surface. We see these darker, cooler regions as sunspots.
The fact that magnetic fields create sunspots presented a problem for astronomers studying the Sun. If you have ever played with toy magnets, you may have discovered that two north poles or two south poles repel each other. How is it then that bundles of same-pole magnetic fields can stay together where they pierce the Sun’s photosphere? In other words, why don’t they push each other apart and thereby create many smaller spots on the Sun? The answer lies under the Sun’s visible layer.
To learn more about the Sun’s interior, astronomers record its vibrations—a study called helioseismology—just as geologists use earthquakes to study Earth’s interior structure. Although there are no true sunquakes, the Sun does vibrate in a variety of ways, somewhat like a vibrating drum head, which, when struck in different places, makes different sounds due to different modes of vibration. Solar vibrations, first noted in 1960, can be detected by using sensitive Doppler shift measurements. Astronomers have observed, for example, that portions of the Sun’s surface move up and down by about 10 km (6 mi) every 5 minutes (Figure 9-12a).
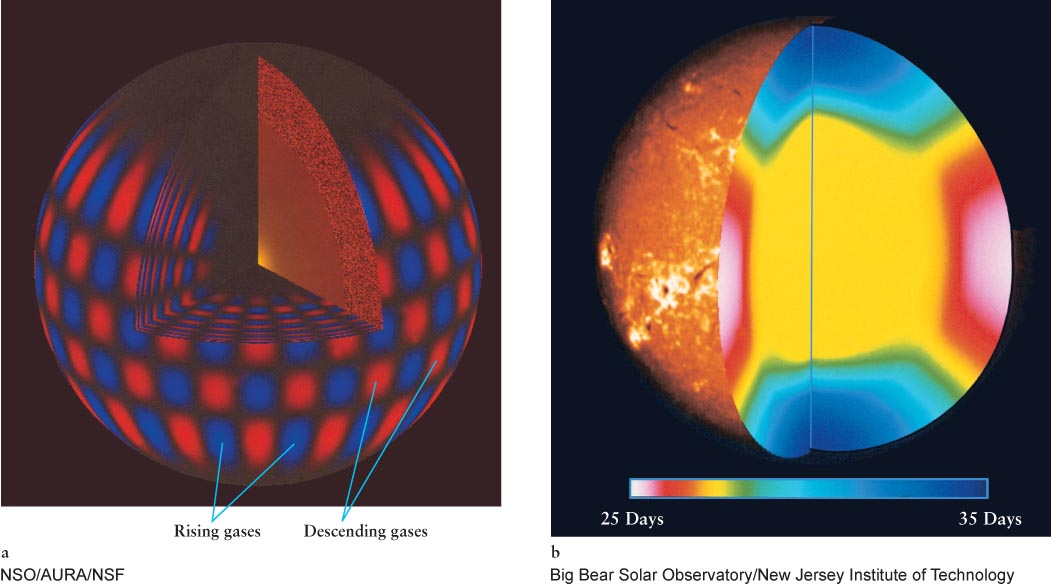
Figure 9-12 Helioseismology (a) This computer-generated image shows one of the myriad ways in which the Sun vibrates because of sound waves resonating in its interior. The regions that are moving outward are blue; those moving inward are red. The cutaway shows how deep these oscillations are believed to extend. (b) This cutaway picture of the Sun shows how the rate of solar rotation varies with depth and latitude. Red and yellow denote faster-than-average motion; blue regions move more slowly than average. The pattern of differential surface rotation, which varies from 25 days at the equator to 35 days near the poles, persists at least 19,000 km (11,800 mi) down into the Sun’s convective layer. Sunspots preferentially occur on the boundaries between different rotating regions. Earthlike jet streams and other wind patterns have also been discovered in the Sun’s atmosphere.
Slower vibrations with periods ranging from 20 minutes to nearly an hour were discovered in the 1970s. Oscillations lasting several days have since been detected, as have pulses 16 months long. One important discovery from helioseismology is that deep inside, the Sun rotates like a rigid body, rather than with the differential rotation we see on its surface (Figure 9-12b).
While observing the vibrations of the Sun around sunspots, astronomers in 2001 apparently found the answer to the question of how sunspots persist for months despite the repulsion of the magnetic fields inside them. They discovered that below the photosphere, the gases that surround each sunspot whip around like hurricanes as large across as Earth’s diameter. The circulation of charged gases around the magnetic fields holds sunspots in place.
Recall from Section 6-5 that magnetic field lines form complete loops, with each magnetic field having a north pole and a south pole. Likewise, when the Sun’s magnetic field emerges through one sunspot or sunspot group, it forms a loop that reenters the Sun at another sunspot or sunspot group (Figure 9-13). We associate the names north pole or south pole with each sunspot or sunspot group, depending on whether the magnetic field there is pointing outward (a south pole) or pointing inward (a north pole). Sunspots and sunspot groups are connected in pairs—one where the magnetic field points out of the Sun, the other where it points into the Sun.
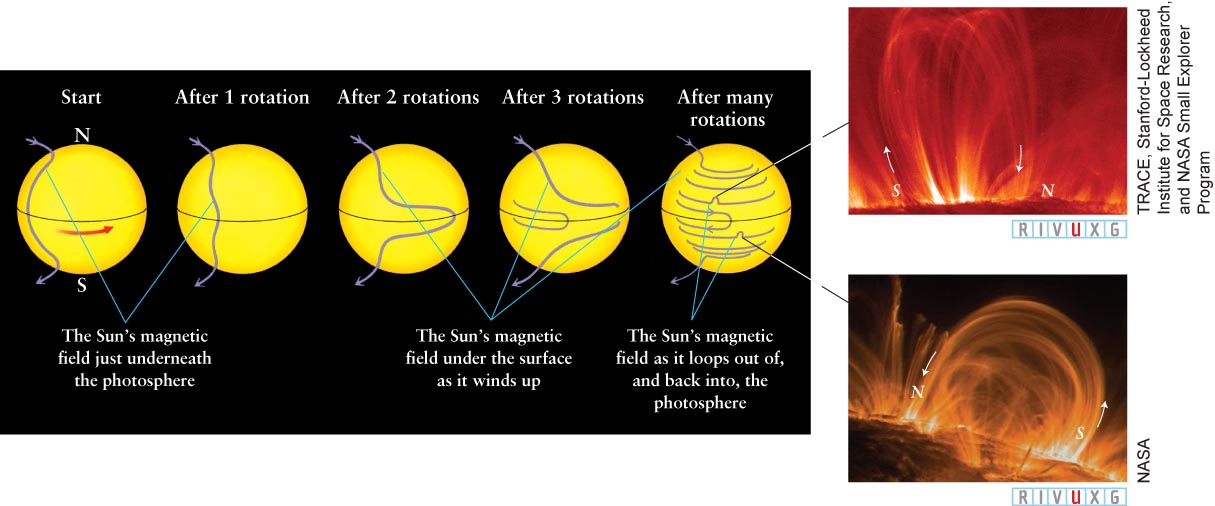
Figure 9-13  Babcock’s Magnetic Dynamo In a plausible partial explanation for the sunspot cycle, differential rotation wraps a magnetic field around the Sun, just under its surface. Convection under the photosphere tangles the field, which becomes buoyant and rises through the photosphere, creating sunspots and sunspot groups. Insets: In each group, the sunspot that appears first as the Sun rotates (on the right side of each loop as you view them) has the same polarity as the Sun’s magnetic pole in that hemisphere (N in the upper hemisphere and S in the lower hemisphere). To understand why, note that magnetic fields make complete loops: If a north pole enters the Sun, it leads to a south pole emerging, and vice versa. Follow the magnetic field in the northern hemisphere from where it enters the Sun (near the top) in counterclockwise loops until you encounter the bump in that hemisphere. Where the field emerges in the bump is a south pole and where it reenters the Sun is a north pole, as shown. Conversely, following the fields in the southern hemisphere, starting at the south pole, you encounter the southern bump from the left, emerging as a north pole and reentering the Sun as a south pole, as drawn. The Sun’s magnetic fields are revealed by the radiation emitted from the gas they trap. These ultraviolet images show coronal loops up to 160,000 km (100,000 mi) high, with gases moving along the magnetic field lines at speeds of 100 km/s (60 mi/s).
During his observations, Hale found that on one hemisphere of the Sun, sunspots with a magnetic north pole always come into view before the corresponding sunspots with a magnetic south pole. At the same time on the other hemisphere, the order is reversed (see Figure 9-13). Hale also found that this pattern reverses itself about every 11 years. The hemisphere where north magnetic poles come first during one 11-year cycle has south magnetic poles coming first during the next. Astronomers, therefore, speak of the 22-year solar cycle, the time it takes solar magnetic fields to return to their original orientation. The Sun is not alone in having its magnetic field reverse. In 2007, astronomers observed the flipping of the magnetic fields of the star Tau Boötis, located 50.9 ly from Earth.
Based on these observations, we can now explain the Sun’s magnetic field. This field is created as a result of the Sun’s rotation and the resulting motion of the ionized particles found throughout it. This theory was proposed in 1960 by another American astronomer, Horace Babcock, as the magnetic dynamo model, in an effort to explain the 22-year solar cycle. When the Sun is quiet, its magnetic field lies just below the surface in the highly conducting plasma located there, unlike Earth’s field, which passes through our planet’s center.
As shown in Figure 9-13, the Sun’s differential rotation causes its magnetic field to become increasingly stretched. Like expanding a rubber band, stretching the field this way causes it to store energy. At the same time, the magnetic field becomes tangled like hair that has not been combed in a while as convection of the gases under the photosphere also causes the fields to rise and fall. Unlike a rubber band, however, magnetic field lines cannot break to release the energy stored in them. Rather, the fields must untangle themselves.
This untangling process begins as the mixed-up regions of magnetic field trap gases. This gas is compressed and heated. Therefore, it expands, and like bubbles in a glass of soda, becomes buoyant and floats up through the solar surface, carrying the magnetic fields with it. Sunspots, filled with magnetic fields typically 5000 times stronger than Earth’s magnetic field, form where loops or tangles of solar magnetic field leave and reenter the Sun. The gas bottled up in the loops of magnetic field eventually leaks out, and the fields untangle, interact with other parts of the Sun’s magnetic field, and gradually settle back under the photosphere, at which point the sunspots associated with them disappear. As noted earlier, this process of magnetic fields piercing the Sun’s surface begins at moderate latitudes, and over the next 11 years it occurs closer and closer to the Sun’s equator (see Figure 9-10).
Because of how these fields interact and vanish, every 11 years the Sun’s entire magnetic field is reversed—the Sun’s north magnetic pole becomes its south magnetic pole, and vice versa. This occurs at the peak of each sunspot cycle. After another 11-year cycle, the field is back to its original orientation. This is why the solar cycle is 22 years long. The most recent reversal of the Sun’s magnetic field occurred in 2013.
Notable irregularities occur in the solar cycle. For example, the overall reversal of the Sun’s magnetic field is often piecemeal and haphazard. More intriguing still is the strong historical evidence that all traces of sunspots and the sunspot cycle have vanished for decades at a time. For example, in 1893 the British astronomer E. Walter Maunder used historical observations to conclude that virtually no sunspots occurred from 1645 through 1715 (see Figure 9-8a). This period, called the Maunder minimum, coincides with a period of cold so extreme in Europe that it was called the Little Ice Age. At the same time, western North America was subject to severe drought.
Similar sunspot-free periods apparently occurred at irregular intervals in earlier times as well. Conversely, periods of increased sunspot activity in the eleventh and twelfth centuries coincided with periods of warmer-than-average temperatures. Interestingly, the minimum that began in 2007 went on longer than any minimum since the one of 1913. Furthermore, the peak of the present sunspot cycle in 2013 had the fewest sunspots in 200 years. Whether these variations from the norm have or will have any bearing on Earth’s global weather remains to be seen. Indeed, the question of whether there is a cause-and-effect link between the number of sunspots and periods of extreme temperatures on Earth is still open.
Insight Into Science
Cause and Effect While extremes of sunspot activity often occur at the same times as weather extremes on Earth, models of these phenomena must also take into account the possibility of purely terrestrial causes for these temperature changes. Remember, just because one event follows another does not mean that the first causes the second.
9-6 Solar magnetic fields also create other atmospheric phenomena
Figure 9-14 shows the active Sun’s chromosphere and lower corona. The bright areas in this photograph are called plages (pronounced plahzh, from the French word for “beaches”). By studying the light emitted by calcium or hydrogen atoms in the plages, we know that they are hotter, and therefore brighter, than the surrounding chromosphere. Plages, which often appear just before nearby sunspots form, are thought to be created by the magnetic fields under the photosphere crowding upward just before they emerge through the photosphere. In pushing upward, the fields compress the gases of the upper Sun, causing this gas to become hotter and therefore to glow more brightly.
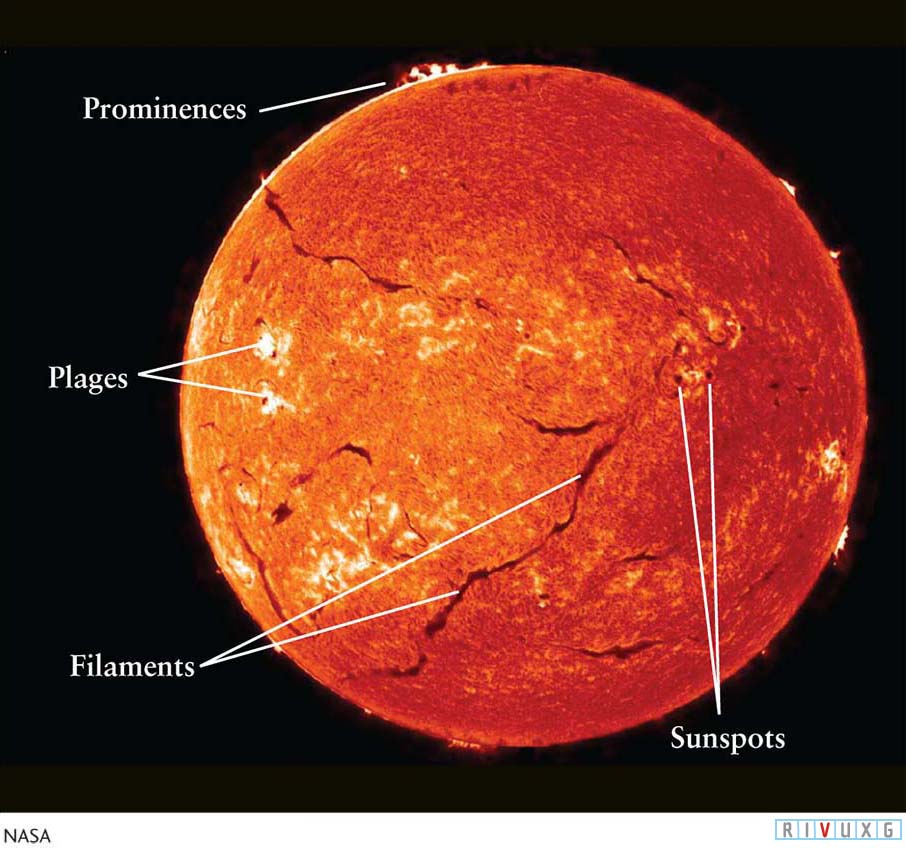
Figure 9-14
Active Sun in Hα This photograph shows the chromosphere and lower corona during a solar maximum, when sunspots are abundant. The image was taken through a filter that allowed only light from Hα emission to pass through. The hot, upper layers of the Sun’s atmosphere are strong emitters of Hα photons. (See Section 3-17 for details of the Balmer series, Hα−H∞.) A few large sunspots are evident. Most notable are features that do not appear at the solar minimum, such as the snakelike features shown here called filaments, bright areas called plages, and prominences (filaments seen edge-on) observed at the solar limb.
Focus Question 9-5
What holds the gas in loops above the Sun’s surface?
The dark streaks in Figure 9-14 are features in the corona called filaments. These features are huge volumes of gas lofted upward from the photosphere by the Sun’s magnetic field. When viewed from the side rather than from above, filaments form gigantic loops or arches, called prominences (Figure 9-15; see also Figure 9-14 and the figure that opens this chapter). The temperature of the gas in prominences can reach 50,000 K. These features are almost always associated with sunspots. Some prominences last for only a few hours, whereas others persist for months.
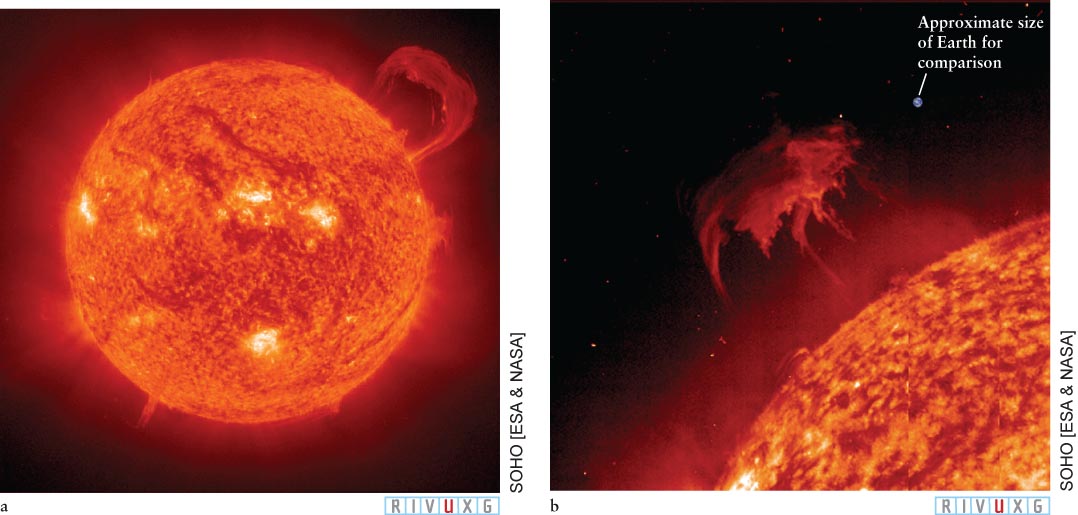
Figure 9-15
Prominences (a) A huge prominence arches above the solar surface in this SOHO image taken in 2001. The radiation that exposed this picture is from singly ionized helium at a wavelength of 30.4 nm, corresponding to a temperature of about 50,000 K. (b) The gas in these prominences was so energetic that it broke free from the magnetic fields that shape and confine it. This coronal mass ejection occurred in 1999 (and did not strike Earth, which is shown for size).
Focus Question 9-6
What two features on the Sun are actually the same thing, seen from different angles?
X-ray photographs also reveal numerous coronal bright and dark spots that are hotter or colder, respectively, than the surrounding corona (Figure 9-16). Temperatures in the bright regions occasionally reach 4 million K. Many of the bright coronal hot spots are located over sunspots. The darker, cooler coronal holes act as conduits for gases to flow out of the Sun. Therefore, when a coronal hole on the rotating Sun faces Earth, the solar wind in our direction increases dramatically.
Violent, eruptive events on the Sun were first discovered to occur in 1859. These solar flares release vast quantities of high-energy particles, as well as X rays and ultraviolet radiation (Figure 9-17), and they last between a few seconds and 5 hours. Solar flares sometimes occur when sunspots collide (Figure 9-18). Typical flares each emit as much energy as is contained in all the fossil fuel ever stored inside Earth. Flares are so powerful that they leave the region of the surface of the Sun in their vicinity quaking for an hour or more. At the maximum of the sunspot cycle, about 1100 flares occur per year. Most of them last for less than an hour, but during that time, temperatures in the Sun’s atmosphere soar to 5 million K. By following the paths of particles emitted by flares as they are deflected by the Sun’s magnetic field, astronomers have, since the 1960s, been mapping that field as it extends out beyond Earth (Figure 9-19).
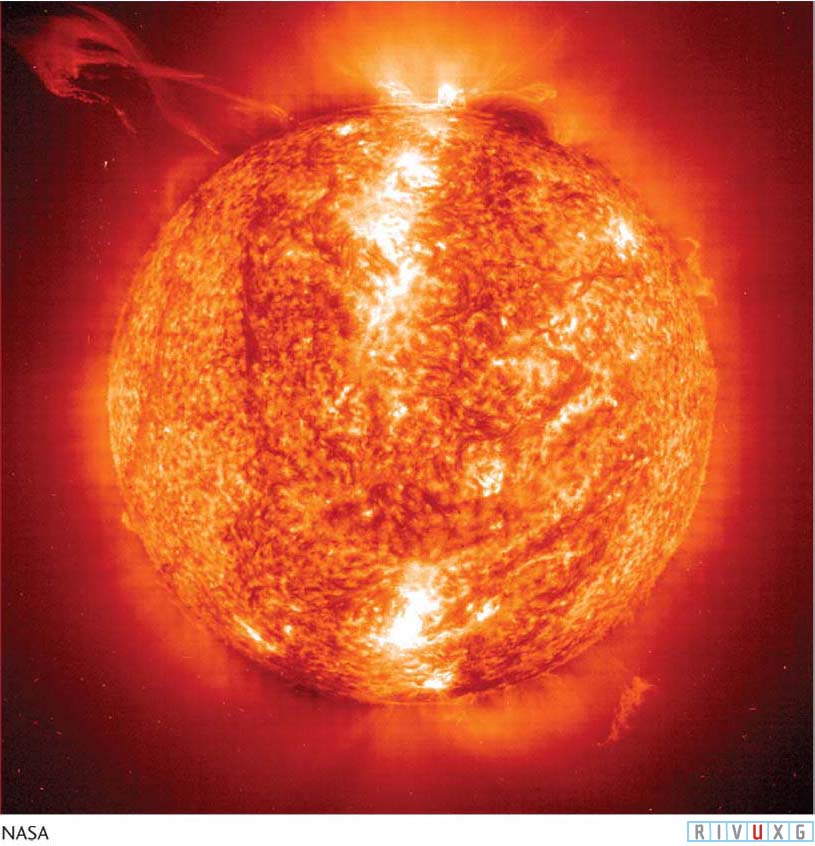
Figure 9-17
A Flare Solar flares, which are associated with sunspot groups, produce energetic emissions of particles from the Sun. This image, taken in 2000 by SOHO, shows a twisted flare (upper left part of figure) in which the Sun’s magnetic field lines are still threaded through the region of emerging particle.
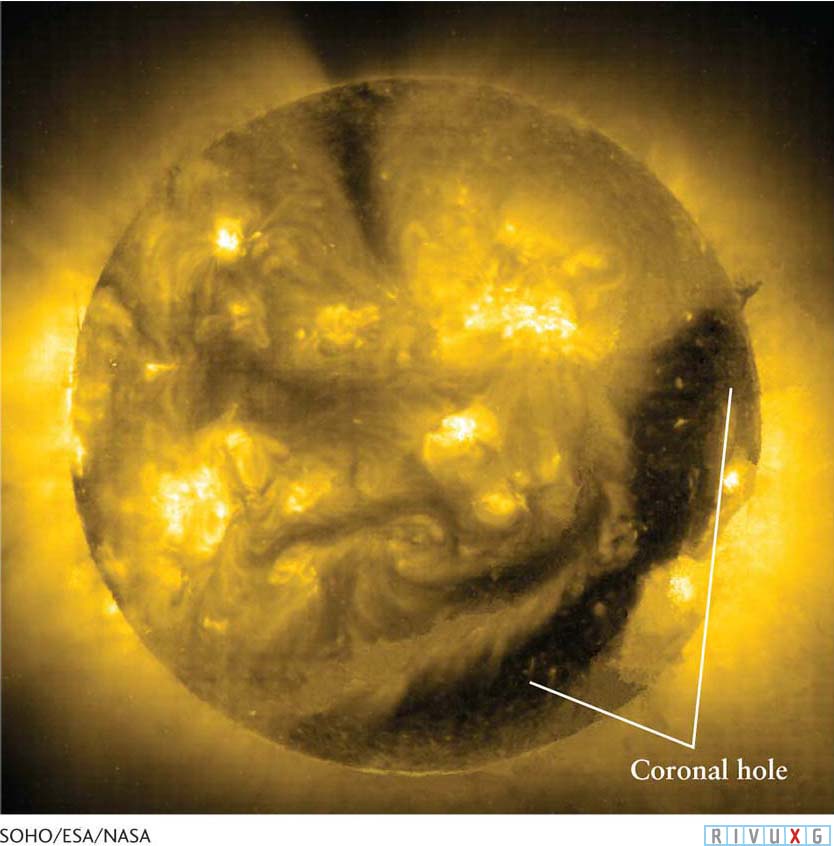
Figure 9-16  A Coronal Hole This X-ray picture of the Sun’s corona was taken by the SOHO satellite. A huge coronal hole dominates the lower right side of the corona. The bright regions are emissions from sunspot groups.
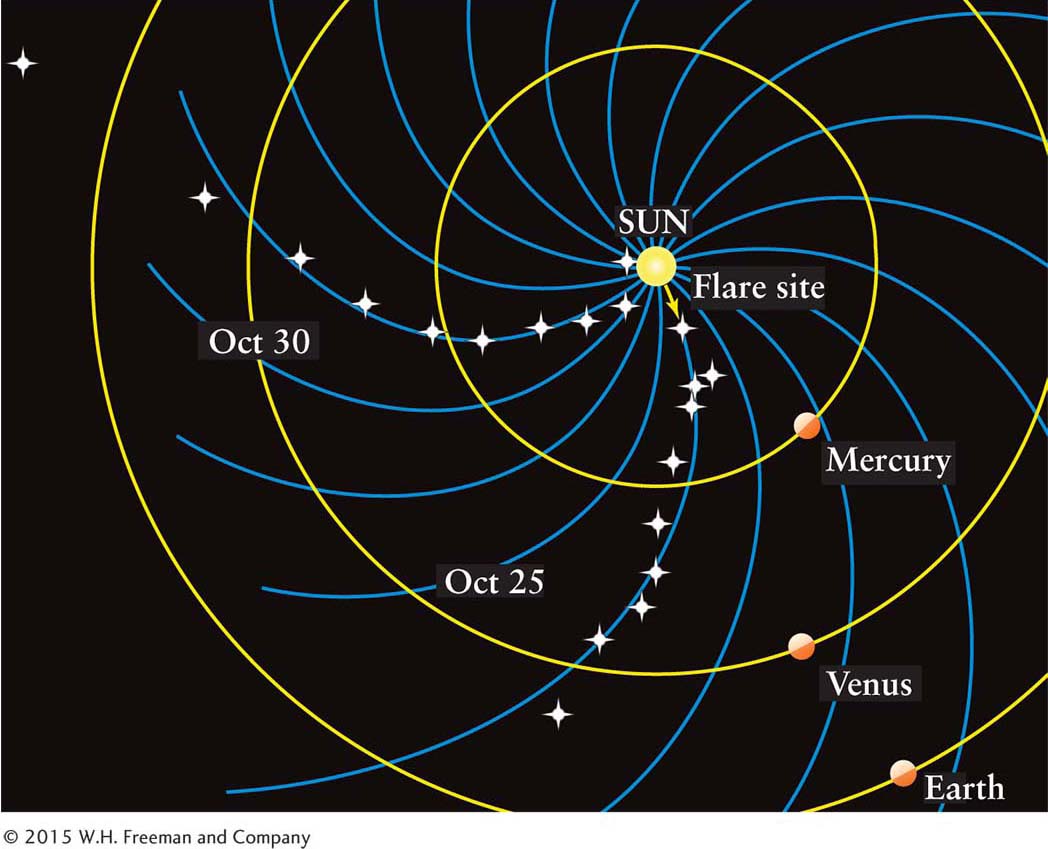
Figure 9-19 A Snapshot of the Sun’s Global Magnetic Field By following the paths of particles emitted by a solar flare, astronomers have begun mapping the solar magnetic field outside the Sun. The field guides the outflowing particles, which, in turn, emit radio waves that indicate the position of the field. These data were collected by the Ulysses spacecraft in 1994. Ulysses was the first spacecraft to explore interplanetary space from high above the plane of the ecliptic.
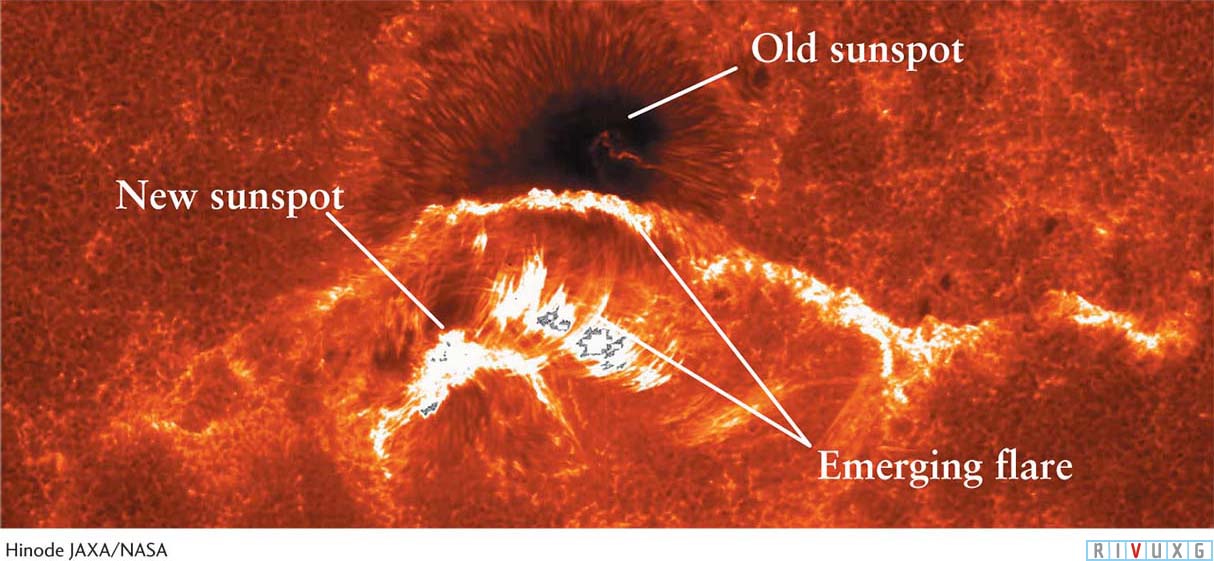
Figure 9-18
Origin of a Solar Flare This Hinode satellite image of the Sun shows a developing sunspot colliding with a pre-existing sunspot. The interacting magnetic fields funnel hot gases rapidly away from the Sun as a solar flare.
Astronomers have also observed huge loop, canopy, or balloon-shaped volumes of high-energy gas being ejected from the corona. These coronal mass ejections expel up to 9 × 10¹² kg (10 billion tons) of matter at 1.4 × 10⁶ km/hr (9.1 × 10⁵ mi/hr), and each one lasts for up to a few hours (Figure 9-20, see also Figure 9-15b). Coronal mass ejections have enough energy to break through the Sun’s magnetic fields that normally contain them or even to carry fields outward. Flares have been observed to create shock waves that initiate some of the coronal mass ejections. The origins of other ejections are still under investigation. The numbers of plages, prominences, flares, and coronal mass ejections vary with the same 11-year cycle as the number of sunspots. Coronal mass ejections, the major source of hazardous particles from the Sun, occur with varying frequency throughout the sunspot cycle, but they never completely cease.
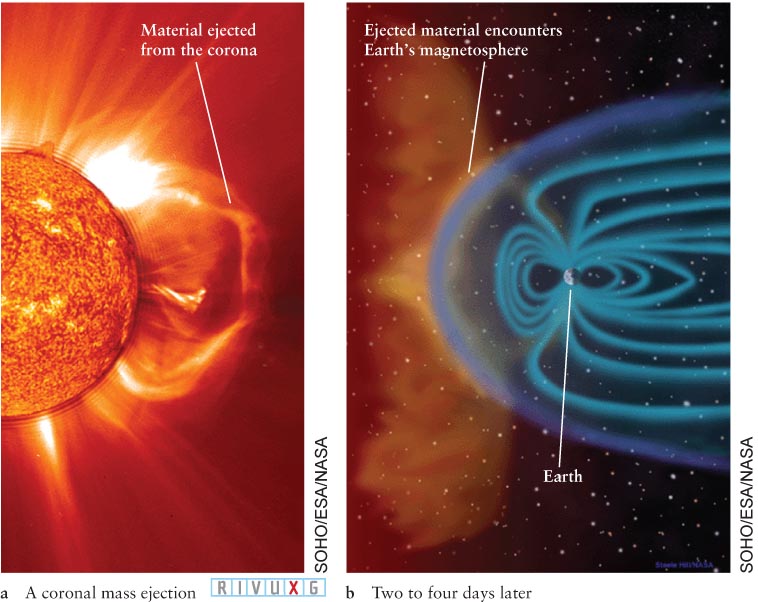
Figure 9-20
A Coronal Mass Ejection (a) An X-ray image of a coronal mass ejection from the Sun taken by SOHO. (b) Two to 4 days later, the highest-energy gases from the ejection reach 1 AU. If they come our way, most particles are deflected by Earth’s magnetic field (blue). However, as shown, some particles leak Earthward, causing aurorae, disrupting radio communications and electric power transmission, damaging satellites, and ejecting some of Earth’s atmosphere into interplanetary space.
Some coronal mass ejections, solar flares, and filaments head toward Earth. Their electromagnetic radiation gets here in about 8 minutes; their high-energy particles arrive a few days later. At times when these surges of particles are not coming to us, the normal solar wind particles are trapped by Earth’s magnetic fields in the regions called the Van Allen belts. The additional particles from a coronal mass ejection or other solar event that do come our way overwhelm the Van Allen belts, enabling matter in them to cascade Earthward. One of the most spectacular of such events in recent years occurred on and around October 31, 2003 (Halloween in the United States), filling the night skies with aurorae in many places around the world (see Section 6-5 for more details on Earth’s magnetic fields and aurorae).
Strong surges of high-energy particles from the Sun damage satellites, disrupt radio communications, short out power grids here, produce intense aurorae in Earth’s atmosphere, cause some of Earth’s atmosphere to gush into interplanetary space, and potentially harm or kill people in space. Collectively, this activity from the Sun that can affect us is called space weather.
Using the technology described in Chapter 3, several spacecraft now monitor the Sun and the space between it and Earth. These spacecraft observe gamma-ray, X-ray, ultraviolet, and visible parts of the Sun’s spectrum, and they provide both scientific and space weather information. These satellites also provide data that allow astronomers to accurately forecast several days in advance the arrival of dangerous levels of solar particles. In the past few years, modeling the Sun’s surface using helioseismology has become so sophisticated that we can even deduce what is happening on the side of the Sun facing away from Earth. As the Sun rotates, any hazardous activity there will sweep into view. By knowing what is coming even weeks ahead of time, astronauts and spacecraft can be better protected than ever before.